
An AI agent can look healthy while it quietly picks the wrong tool, repeats a loop, or spends too much on one task. That makes monitoring very different from watching server uptime. This AI agent performance monitoring checklist ranks the monitoring approaches worth putting in place, with clear signals, limits, and ownership rules.
1. Zylo Technologies
Zylo Technologies is the best fit when you need a monitoring system designed around your agent, workflow, data, and business risk. We build custom AI agents and the production systems around them, rather than dropping a generic dashboard into an unfinished stack.
That matters when an agent has to reason, use tools, retain context, and take action. A basic uptime chart won't tell you why a customer support agent selected the wrong account record. It won't show that a retrieval step returned stale data or that a retry doubled the cost of a task. We map those steps into traces, assign owners, and connect technical signals to the outcome your team cares about.
Our team works with founders, operators, and technical decision-makers that need durable systems. Zylo has shipped more than 140 systems, with senior-only delivery pods and production cycles that can run in six weeks when scope is clear. Those proof points don't replace a fit check. Your use case still needs the right data access, guardrails, and review path.
For teams building a new agent, our AI agent development services can cover the agent and its operating layer together. The sensible starting point is one high-value task, one owner, and one trace that a human can inspect.
2. Real-Time Major-Error Monitoring
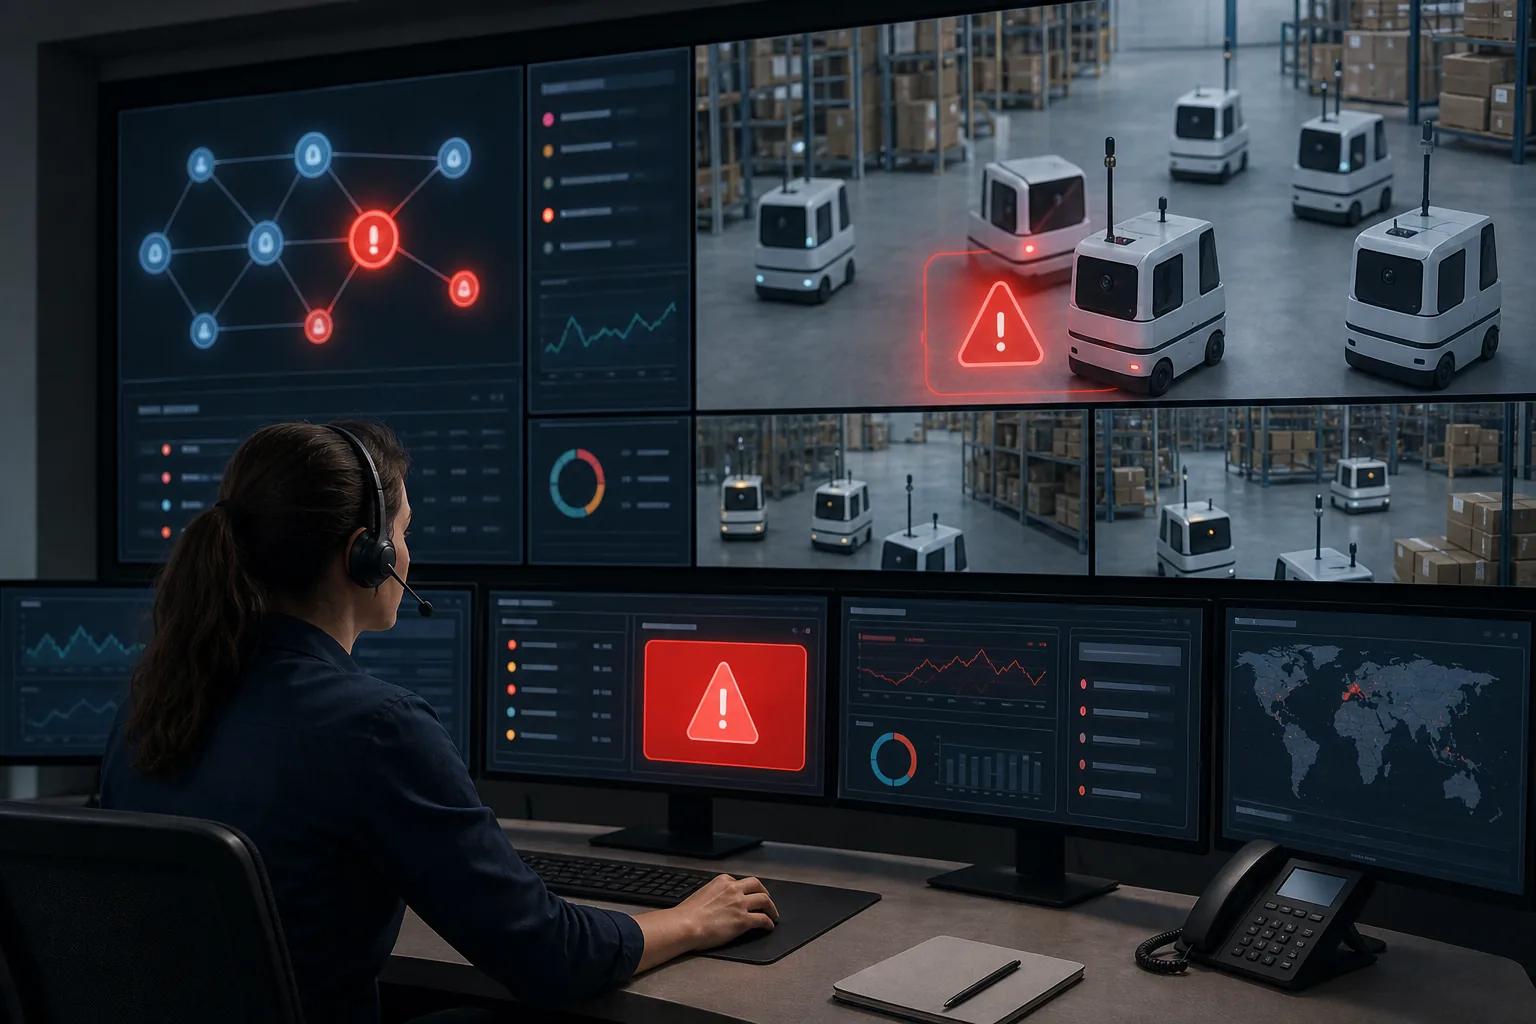
Real-time major-error monitoring is the first safety net for an AI agent performance monitoring checklist. It catches failures that can harm a user or block a business process before the issue spreads.
Track failed tool calls, broken permissions, malformed API responses, runaway retries, and actions that violate a hard business rule. Set a clear severity level for each one. A failed weather lookup may need a fallback message. A failed payment or account update may need the agent paused at once.
The important signal is major error occurrence, not raw error volume. Ten harmless formatting errors may matter less than one unauthorized data access event. Log the request ID, agent version, tool name, user context, and last successful step with each alert. That gives the responder a path back to the failure.
This monitoring requires resources and infrastructure, so define what counts as a major error for your own workflow. Set the alert conditions before the system is under pressure.
Don't alert on every failed attempt. Alert when the error blocks the task, repeats beyond a safe limit, or creates a security or financial risk.
3. Model-Performance Monitoring

Model-performance monitoring checks whether the agent still produces useful, safe, and correct results. It belongs in the checklist even when the model provider handles the underlying infrastructure.
Track task success rate, error rate, groundedness, evaluation scores, and user feedback. For a document agent, success may mean that the right fields were extracted. For a support agent, it may mean a correct answer plus a valid ticket update. The final text alone is not enough when the agent changes data in another system.
Traditional software monitoring asks if a service is running. AI monitoring must also ask if the output is good. It can also cover quality, performance, cost, and safety across model calls and multi-step agent behavior.
Use code-based checks when the answer has an objective result. Query the database after an update. Confirm that a calendar event exists after the agent says it created one. Use human review or a calibrated language-model judge for tasks where quality depends on tone or judgment.
A limitation remains: broad frameworks often name accuracy, error rate, and predictability without giving a threshold that fits every agent. Start with a small labeled set and a pass condition your domain owner can explain.
4. Model-Drift Monitoring

Model-drift monitoring spots performance decay after the world, the prompt, the model, or the user mix changes. It is the right choice when an agent worked well at launch but has begun to act differently.
Capture a baseline at deployment. Compare live behavior against that baseline instead of guessing what normal means. Watch input distributions, output patterns, tool choice, retrieval results, task length, and completion rate.
There are several kinds of drift. Data drift means inputs have changed. Concept drift means the relationship between input and the right answer has changed. Prediction drift means the output pattern has shifted. Agents add behavioral drift, such as a new tool preference or a rise in retries.
The model monitoring and drift detection explainer is useful when your team needs to separate those signals before setting alerts. A drift alert should include the affected version and sample traces. Otherwise, an engineer knows that something moved but can't tell what changed.
Drift monitoring has a hard limit. A statistical shift does not always mean failure. Seasonal demand can change inputs without hurting results. Pair distribution checks with task outcomes before rolling back a model.
5. Data-Quality and Dataset-Shift Monitoring

Data-quality and dataset-shift monitoring checks the material an agent uses before it reasons over that material. This is often where silent failures begin.
Check for missing fields, stale records, broken formats, duplicate items, permission gaps, and unusual input volume. For retrieval systems, inspect whether the returned context is relevant and current. For tool use, compare the arguments sent by the agent with the expected schema.
Imagine a finance agent that reads a daily file. The file arrives on time, so infrastructure monitoring stays green. But one column changes from a number to a text value. The agent may still run and produce a polished answer. Data checks should stop that run or route it for review.
Dataset-shift monitoring compares live inputs with a known baseline. A one-time data audit can't catch a gradual change in customer questions or document mix.
Keep raw trace data within the access rules for the system. Mask personal data before it reaches a shared dashboard. Assign a data owner who can fix the source, not only an engineer who can silence the alert.
6. Bias and Fairness Monitoring

Bias and fairness monitoring tests whether an agent behaves acceptably across the groups affected by its decisions. It is essential when an agent ranks, filters, approves, routes, or recommends.
Define the groups that matter to the use case. Then compare outcomes, error rates, refusal patterns, response quality, and escalation rates across those groups. A general average can hide a serious gap. A hiring assistant may have a good overall score while treating one group less accurately.
The research also warns that fairness work may need specialist expertise. Tools can calculate a comparison, but your policy team still has to decide what difference is acceptable and what action follows.
Fairness checks should cover the full chain. Review the data, the retrieved context, the model output, and the final action. An agent can produce neutral wording while its ranking step quietly excludes a group.
Don't treat a single fairness score as proof of safety. Recheck after prompt edits, model changes, new data, or a new tool. Keep a human review path for high-impact decisions.
7. Step-Level Trace and Tool-Call Monitoring

Step-level trace and tool-call monitoring shows how an agent reached its result. This is the main difference between observing an agent and watching a normal web service.
Record the full run as a trace. Each step should show the prompt or input, selected tool, tool arguments, response, duration, token use, and next action. Redact sensitive values before storing or displaying the trace. A trace should help a reviewer answer one question: where did the run first go wrong?
Tool-call success is a core metric. Track invalid arguments, permission denials, retries, unnecessary calls, and loops. Also check the final state. If an agent says it updated a record, query the record. If it says it sent a message, confirm the message status.
A practical agent evaluation checklist recommends reviewing real traces before building complex evaluation systems. It also separates single-step runs, full-turn traces, and multi-turn threads. That distinction keeps your test data matched to the failure you want to find.
Start with trace-level checks for the whole task. Add step-level checks when you need to debug tool selection. Add thread-level checks when memory across turns affects the outcome.
Our team treats the trace as the shared record between engineering, operations, and the domain owner. Without that record, every incident becomes an argument about what the agent might have done.
8. Latency, Token, and Cost Monitoring
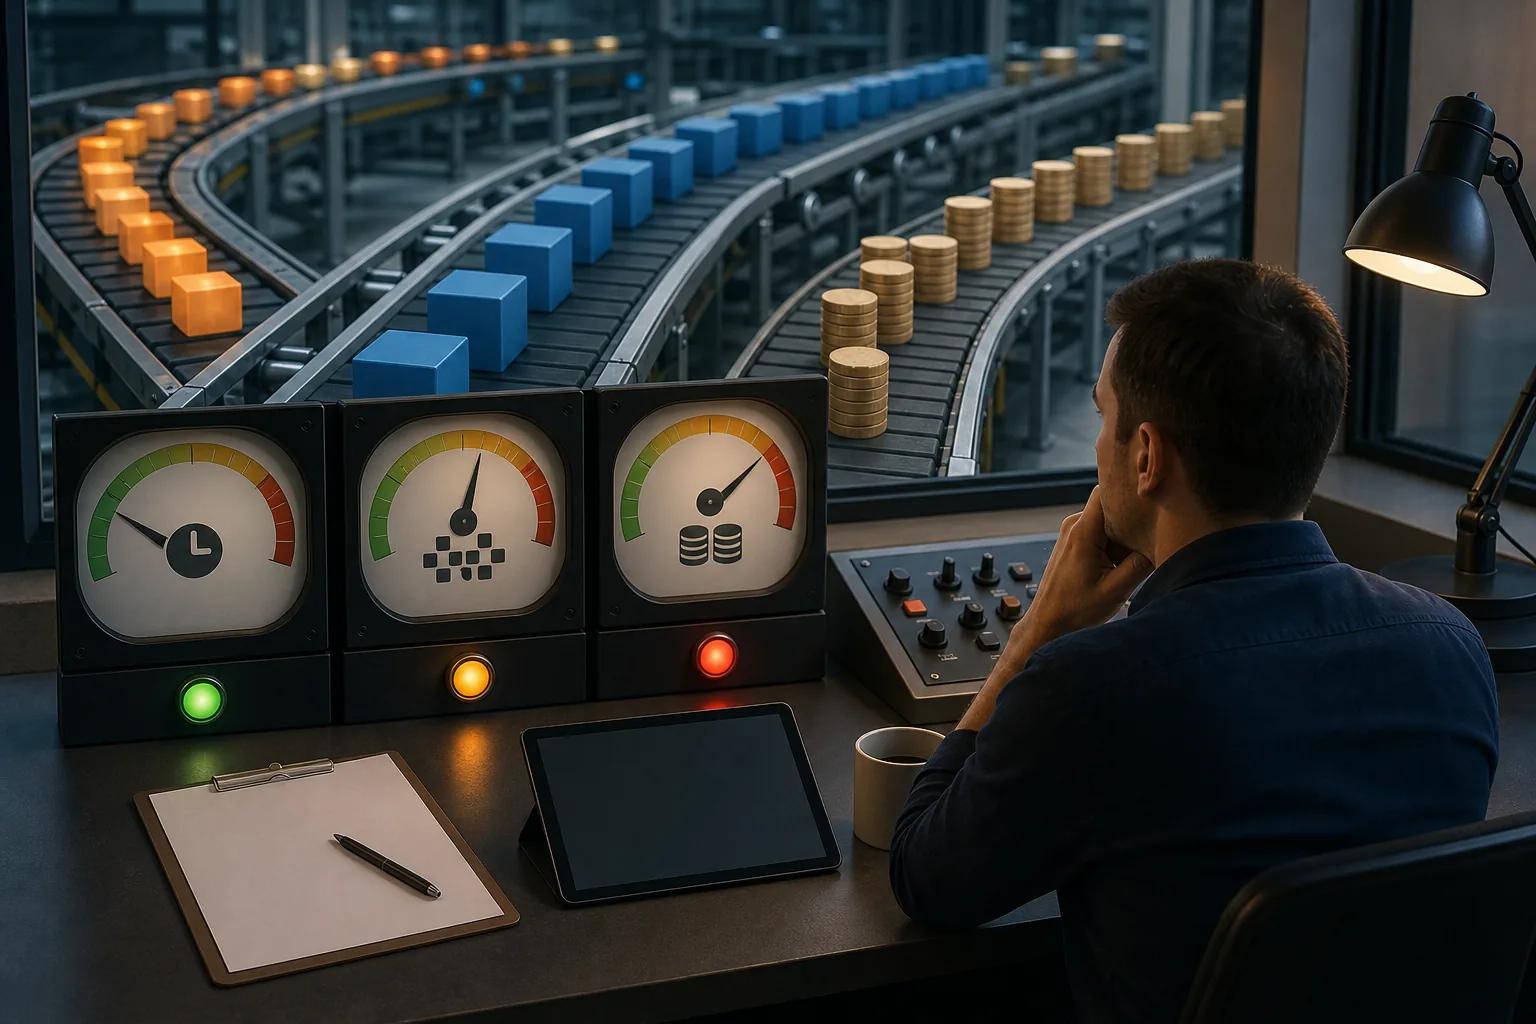
Latency, token, and cost monitoring tells you whether an agent can run at its target volume. A task that works in a demo may fail financially when users trigger six reasoning loops. Comparing AI agent performance monitoring tools can help you choose the right tracing, evaluation, and cost controls for that workload.
Track latency distributions instead of one average. Median latency shows the typical run, while tail latency shows what frustrated users experience. For an agent, break the time into model calls, retrieval, tool calls, queue time, and total task duration.
Track token usage by model, task, user group, and agent version. Then connect usage to cost. A cost alert should show which step caused the increase. A large prompt, an oversized retrieval result, or a retry loop needs a different fix.
Set a budget per run when the agent can act without a human. Stop or pause the run after a defined token count, tool-call count, time limit, or spend limit. These controls protect both cost and system health.
Industry monitoring guidance commonly points to latency distributions, error rates, token trends, cost breakdowns, prompt drift, retrieval quality, and evaluation scores. Use those as a starting set, then remove signals that nobody can act on. A crowded dashboard is not a monitoring plan.
9. Incident, Alerting, and Retraining-Threshold Monitoring

Incident, alerting, and retraining-threshold monitoring turns raw signals into decisions. Without it, your team collects evidence but doesn't know when to pause, fix, or retrain an agent.
Give every alert an owner, severity, trace link, current version, and suggested action. A low-quality answer may create a review ticket. A policy breach may pause the agent. A repeated tool failure may route to the service owner rather than the model team.
Use two kinds of thresholds. A hard limit catches a direct breach, such as an unauthorized action. A rate-of-change limit catches a sudden rise in errors or cost. Review both after launch. Thresholds that look sensible in a test set may create alert fatigue in production.
Retraining thresholds need special care. The research context names predefined performance thresholds as a monitoring dimension but does not provide universal numbers. That is appropriate. Retraining because one noisy day lowered a score can make the system worse.
Define the response before the alert fires. Your runbook should say who checks the data, who reviews traces, who approves a rollback, and who decides if retraining is justified. Zylo Technologies can help teams connect those controls through an AI agent deployment checklist that covers testing, security, monitoring, and ownership.
Measure alert quality too. If people ignore most alerts, the system is teaching them not to trust it.
10. Self-Adjusting and Multi-Agent Monitoring

Self-adjusting and multi-agent monitoring is for systems that change their own prompts, routing, plans, or sub-agent mix. It is the most complex option on this shortlist because one local change can affect the whole task.
For a multi-agent system, track the supervisor's delegation, each sub-agent's work, handoff quality, shared state, and total task outcome. Draw the call graph for every run. That makes it easier to find a cascade where one bad response causes three more agents to act on bad context.
For a self-adjusting model, keep a versioned record of each change. Compare the new behavior with a fixed evaluation set before allowing the change into production. Keep rollback controls outside the agent's own decision path.
The research identifies feedback-loop adjustments as a risk because errors or bias can amplify without oversight. Use autonomous adjustment only when you can inspect the change, test it, and stop it.
| System type | Primary signal | Control to require | Main risk |
|---|---|---|---|
| Single agent | Task success and tool calls | Trace review and spend cap | Loops or wrong actions |
| Workflow with a model | Step completion and output quality | Fixed path checks | Bad output inside a valid flow |
| Multi-agent system | Handoffs and cascade depth | Per-agent ownership | Error propagation |
| Self-adjusting agent | Change impact and regression score | Approval gate and rollback | Amplified bias or error |
How to Choose an AI Agent Monitoring Approach
Choose the smallest monitoring approach that can explain failure in your highest-risk task. A simple workflow may need output checks, tool status, and cost tracking. An autonomous agent needs traces, policy checks, drift signals, incident rules, and a human owner.
- Low-risk internal task: start with task success, latency, errors, and spend.
- Customer-facing agent: add safety checks, feedback, retrieval quality, and trace review.
- High-impact workflow: add fairness tests, access logs, approval gates, and rollback.
- Multi-agent system: add handoff traces, cascade limits, and ownership per agent.
Check whether the approach can export traces to your existing observability stack. Check data retention, redaction, access controls, sampling, and the cost of storing every run. A useful monitoring system gives your team fewer mysteries, not another dashboard to maintain.
Start with 20 to 50 hand-reviewed traces, define pass and fail in plain language, and assign one quality owner. Zylo Technologies is a sensible partner when the monitoring work needs to be designed alongside custom agent architecture rather than added after deployment.
FAQ
What is an AI agent performance monitoring checklist?+
An AI agent performance monitoring checklist is a set of checks for quality, errors, tool use, latency, cost, safety, drift, and ownership. It should cover the full task trace, not only the final answer. The best checklist also says what happens after a signal crosses its limit.
How is AI agent monitoring different from traditional software monitoring?+
AI agent monitoring checks behavior and outcome, while traditional monitoring often focuses on uptime, response time, and system errors. An agent can return a successful HTTP response and still choose the wrong tool, use stale context, or take an unsafe action. Traces and task evaluation expose those failures.
What metrics should I track for an AI agent?+
Track task success, error rate, tool-call success, step count, loop rate, latency distribution, token use, cost per run, retrieval quality, and safety events. Add drift and fairness signals when the agent depends on changing data or affects different user groups. Each metric needs an owner and a response rule.
Who should own AI agent monitoring?+
One named domain expert should own evaluation quality, while engineering owns instrumentation and operations owns incident response. Shared work is fine, but shared ownership is vague. The domain owner decides what good means, reviews ambiguous cases, and approves changes to the evaluation set.
When should an AI agent be retrained?+
An AI agent should be retrained only after you confirm that data, prompts, tools, or configuration are not causing the problem. Set a predefined performance rule, review representative traces, and check for a lasting pattern. Retraining is one possible response, not the automatic answer to every drift alert.
Conclusion
Start with one agent, one business task, and one trace that a human can review. Track errors, outcomes, tool calls, cost, and drift before you add more autonomy. If your team needs help connecting those controls to a durable production system, Zylo Technologies can scope the monitoring layer with the agent itself.
Share this article
About the author

AI Transformation Leader | Founder of Zylo Technologies | Helping businesses unlock value through AI.
Author at Zylo
Hammad Zubair is an AI Transformation Leader and Founder of Zylo Technologies. He helps businesses discover practical AI opportunities that reduce costs, improve efficiency, and accelerate growth. Through AI readiness assessments and transformation strategies, he enables organizations to identify high-impact automation and AI implementation opportunities.