
Financial Analyticsdata-driven decisions
Financial analytics dashboard
financial analytics dashboard

Client
FinFlow
Industry
Fintech
Headquarters
Japan
Services
UI/UX Design
About project
FinFlow is a financial analytics platform that transforms raw transaction data into structured insights — giving CFOs and finance teams real-time visibility into spending patterns, forecasting, and budget performance.
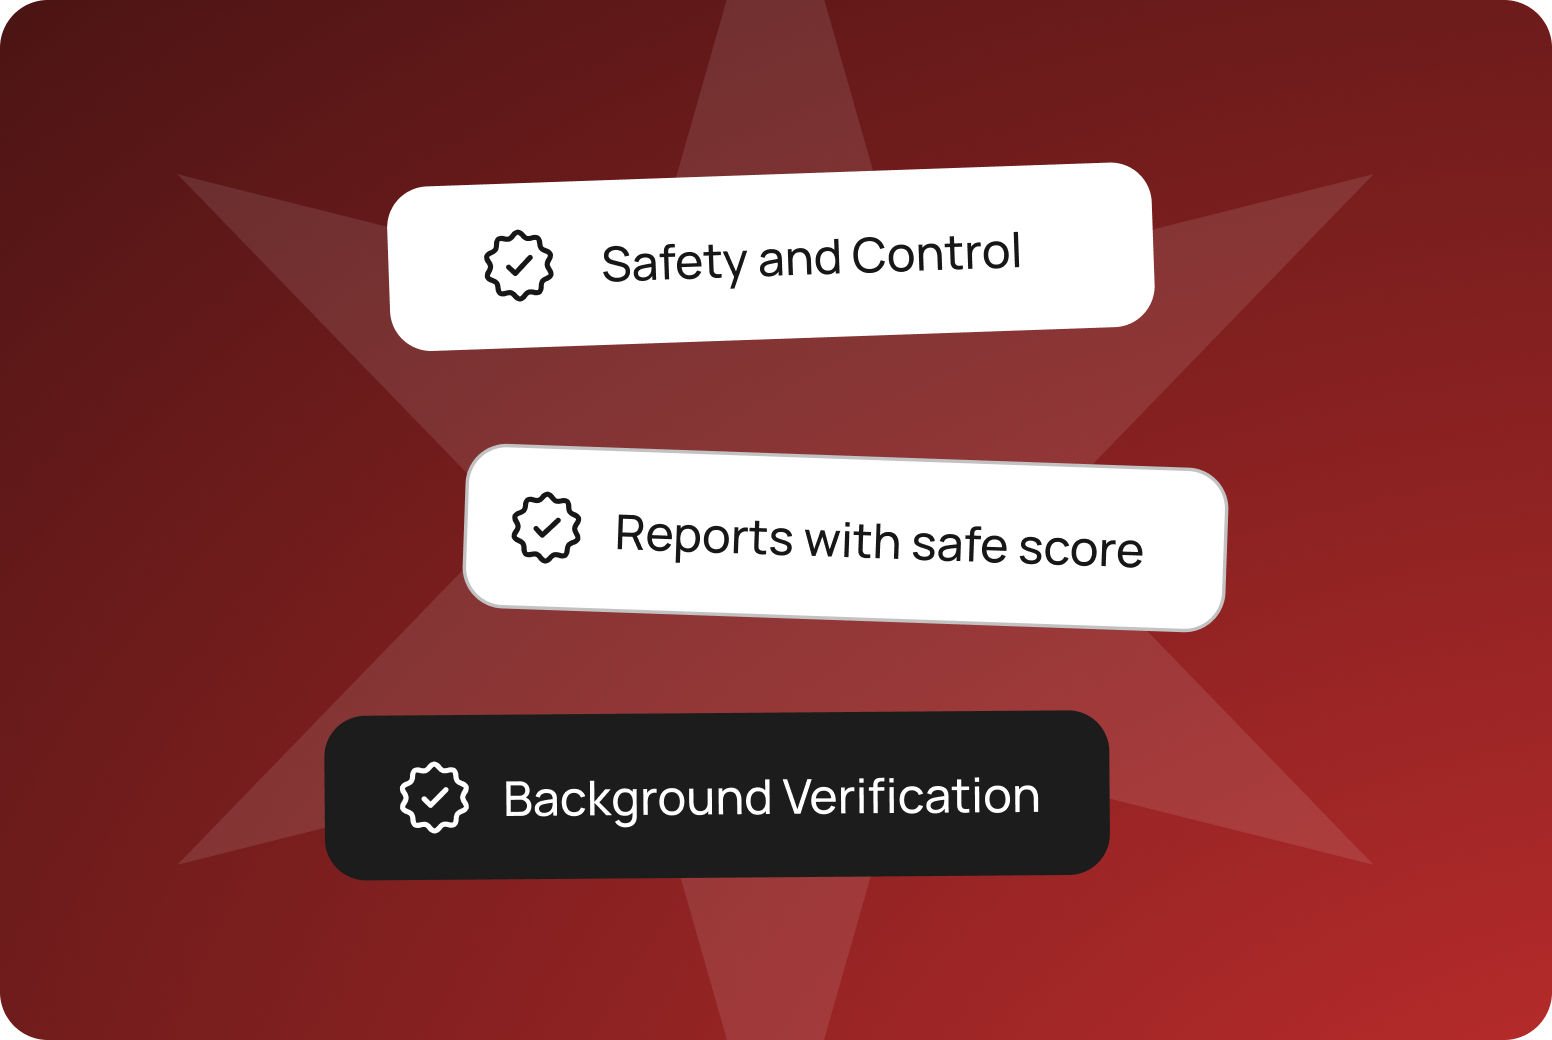
Human-Readable Translation
Send 100 USDC to secure Vault
Auto-Recovery Security Shield Enabled
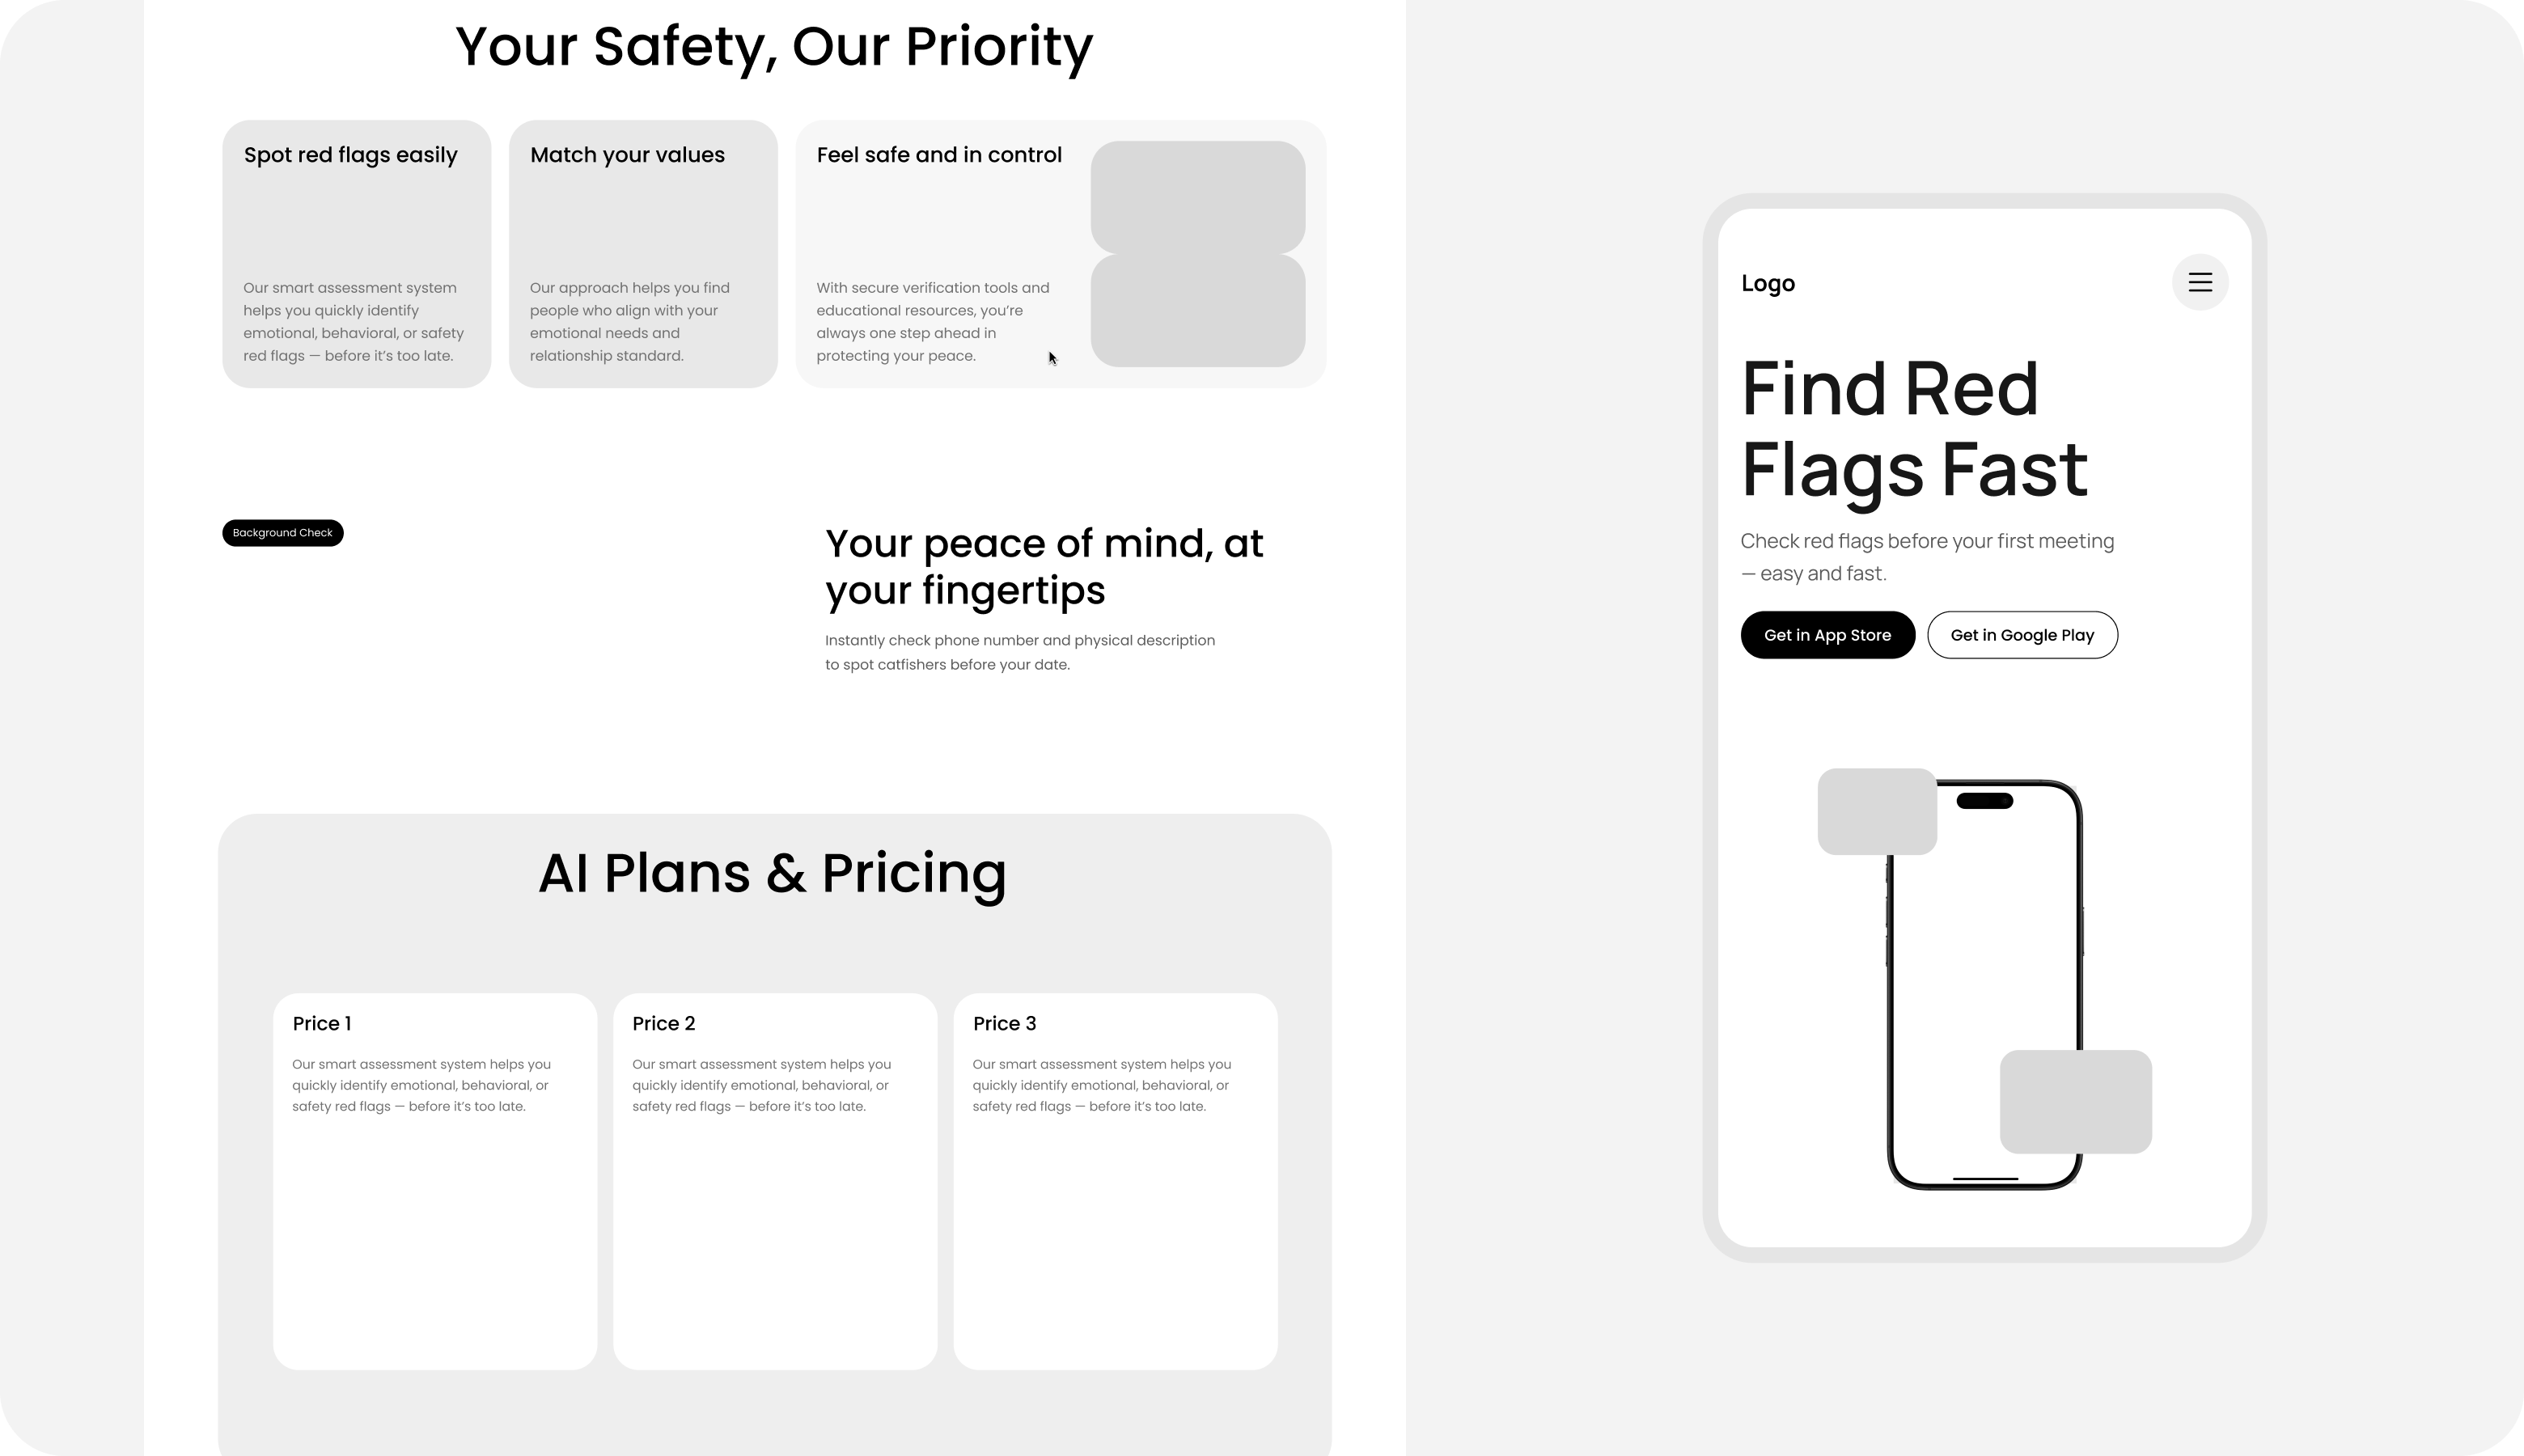
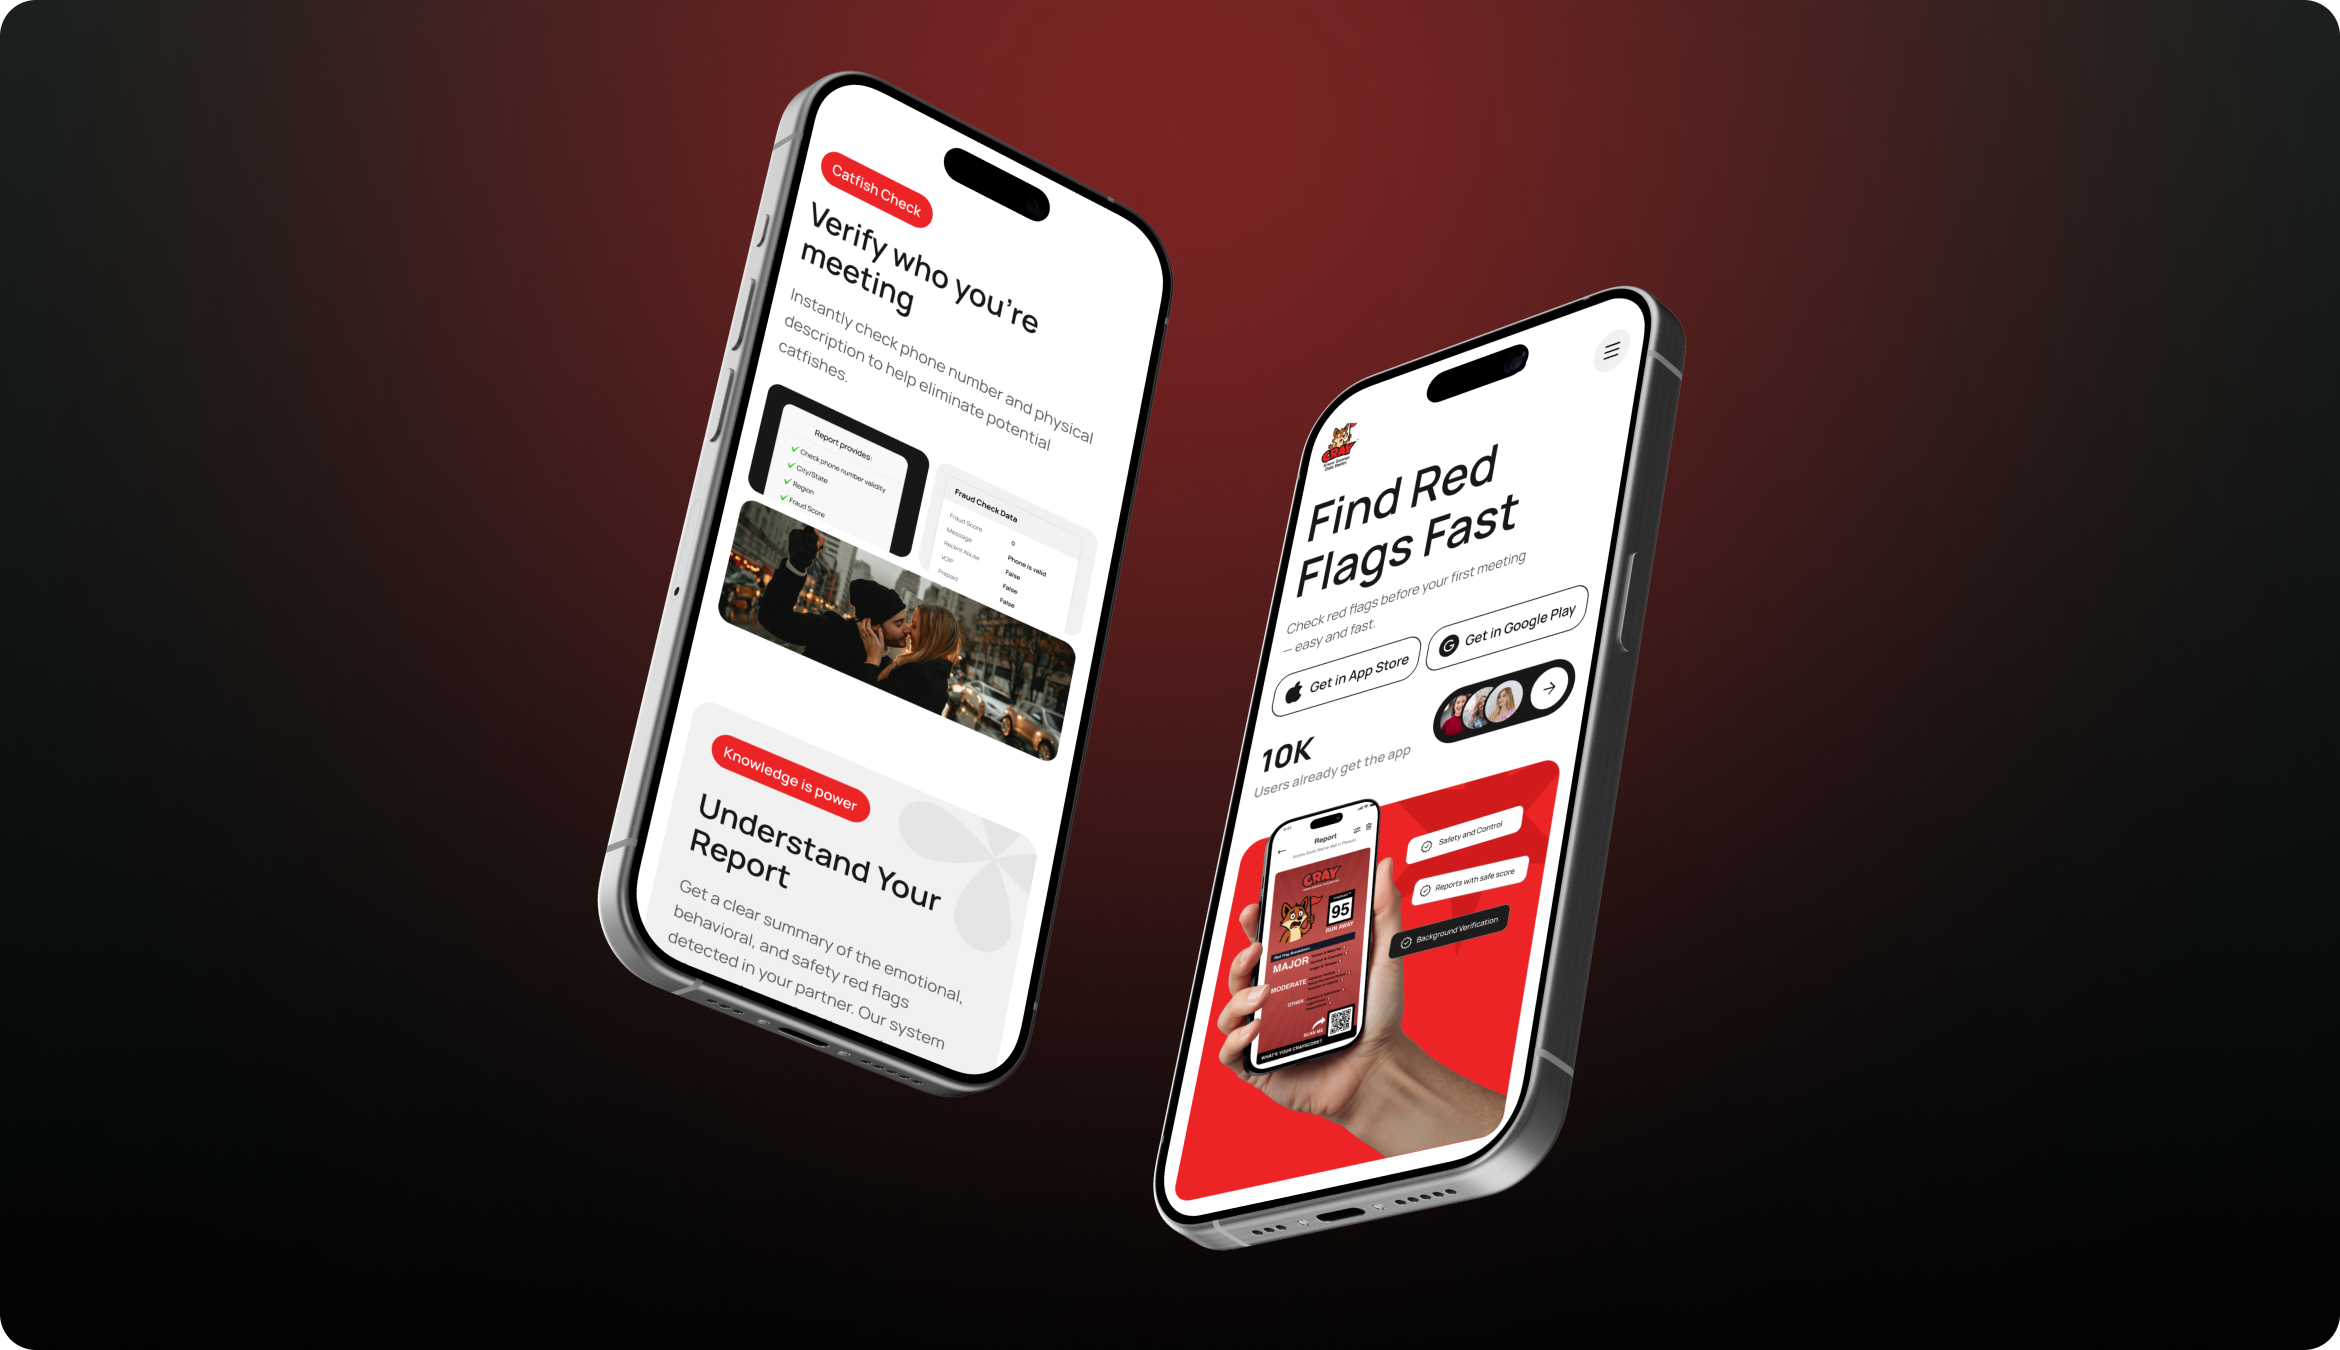
Web3 Security, Redefined.
We engineered a hardware-compatible interface that translates confusing crypto actions into clean, readable experiences.
Finance teams relied on static spreadsheets and delayed reporting cycles that obscured real-time financial performance and slowed strategic decision-making.
Zylo designed a real-time financial dashboard with automated transaction categorization, forecast modeling, and structured variance analysis — replacing manual reporting workflows.
Process
Discovery
Financial data source mapping
Reporting workflow analysis
KPI framework design
System integration audit
Forecasting model review
Analytics Architecture
Data ingestion pipeline
Categorization engine
Forecast model structure
Dashboard data layer
Alert logic design
Implementation
Integration development
Data validation
Performance testing
Finance team training
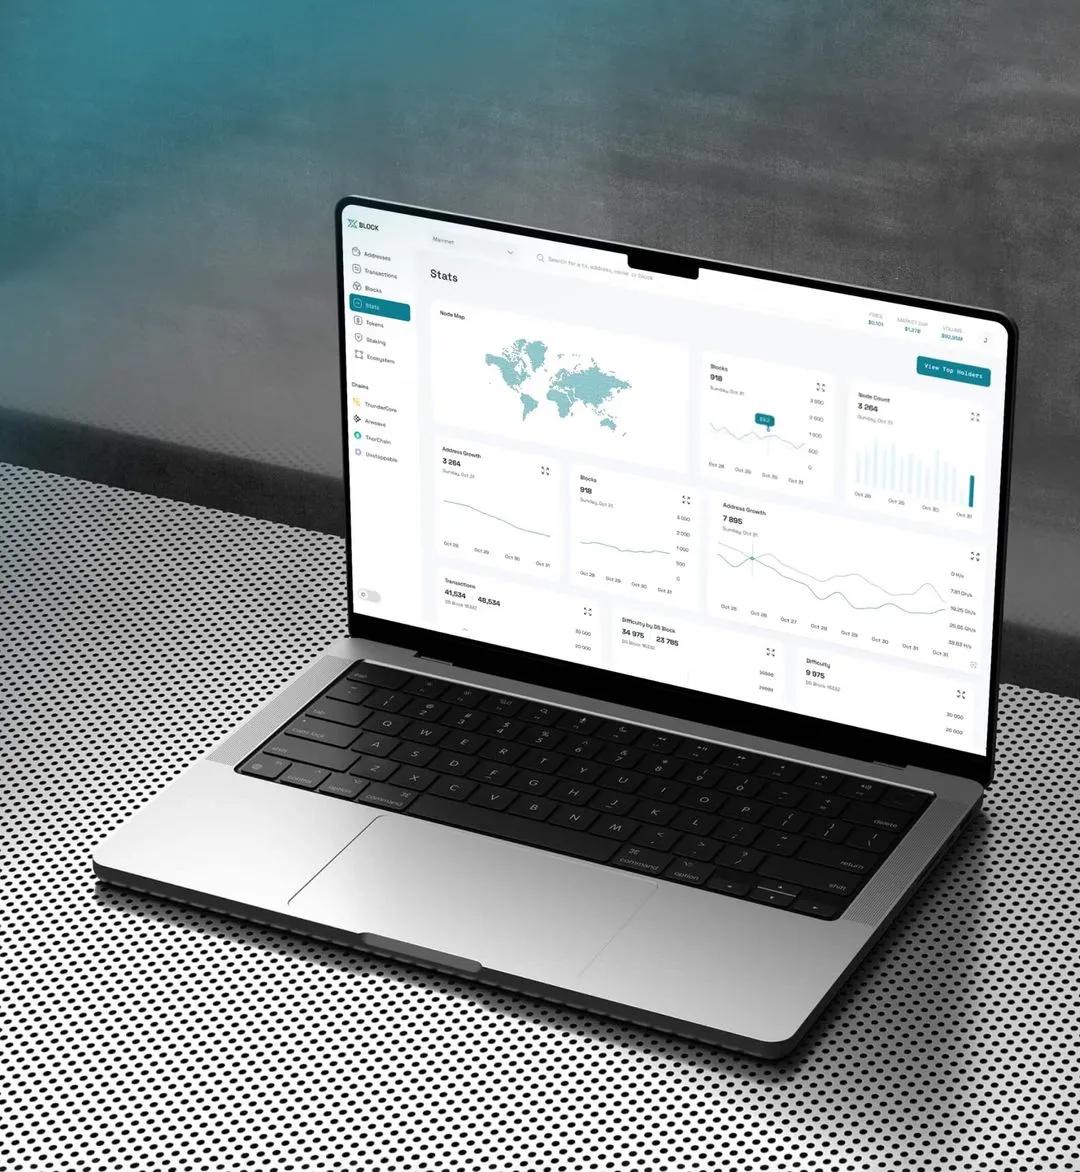
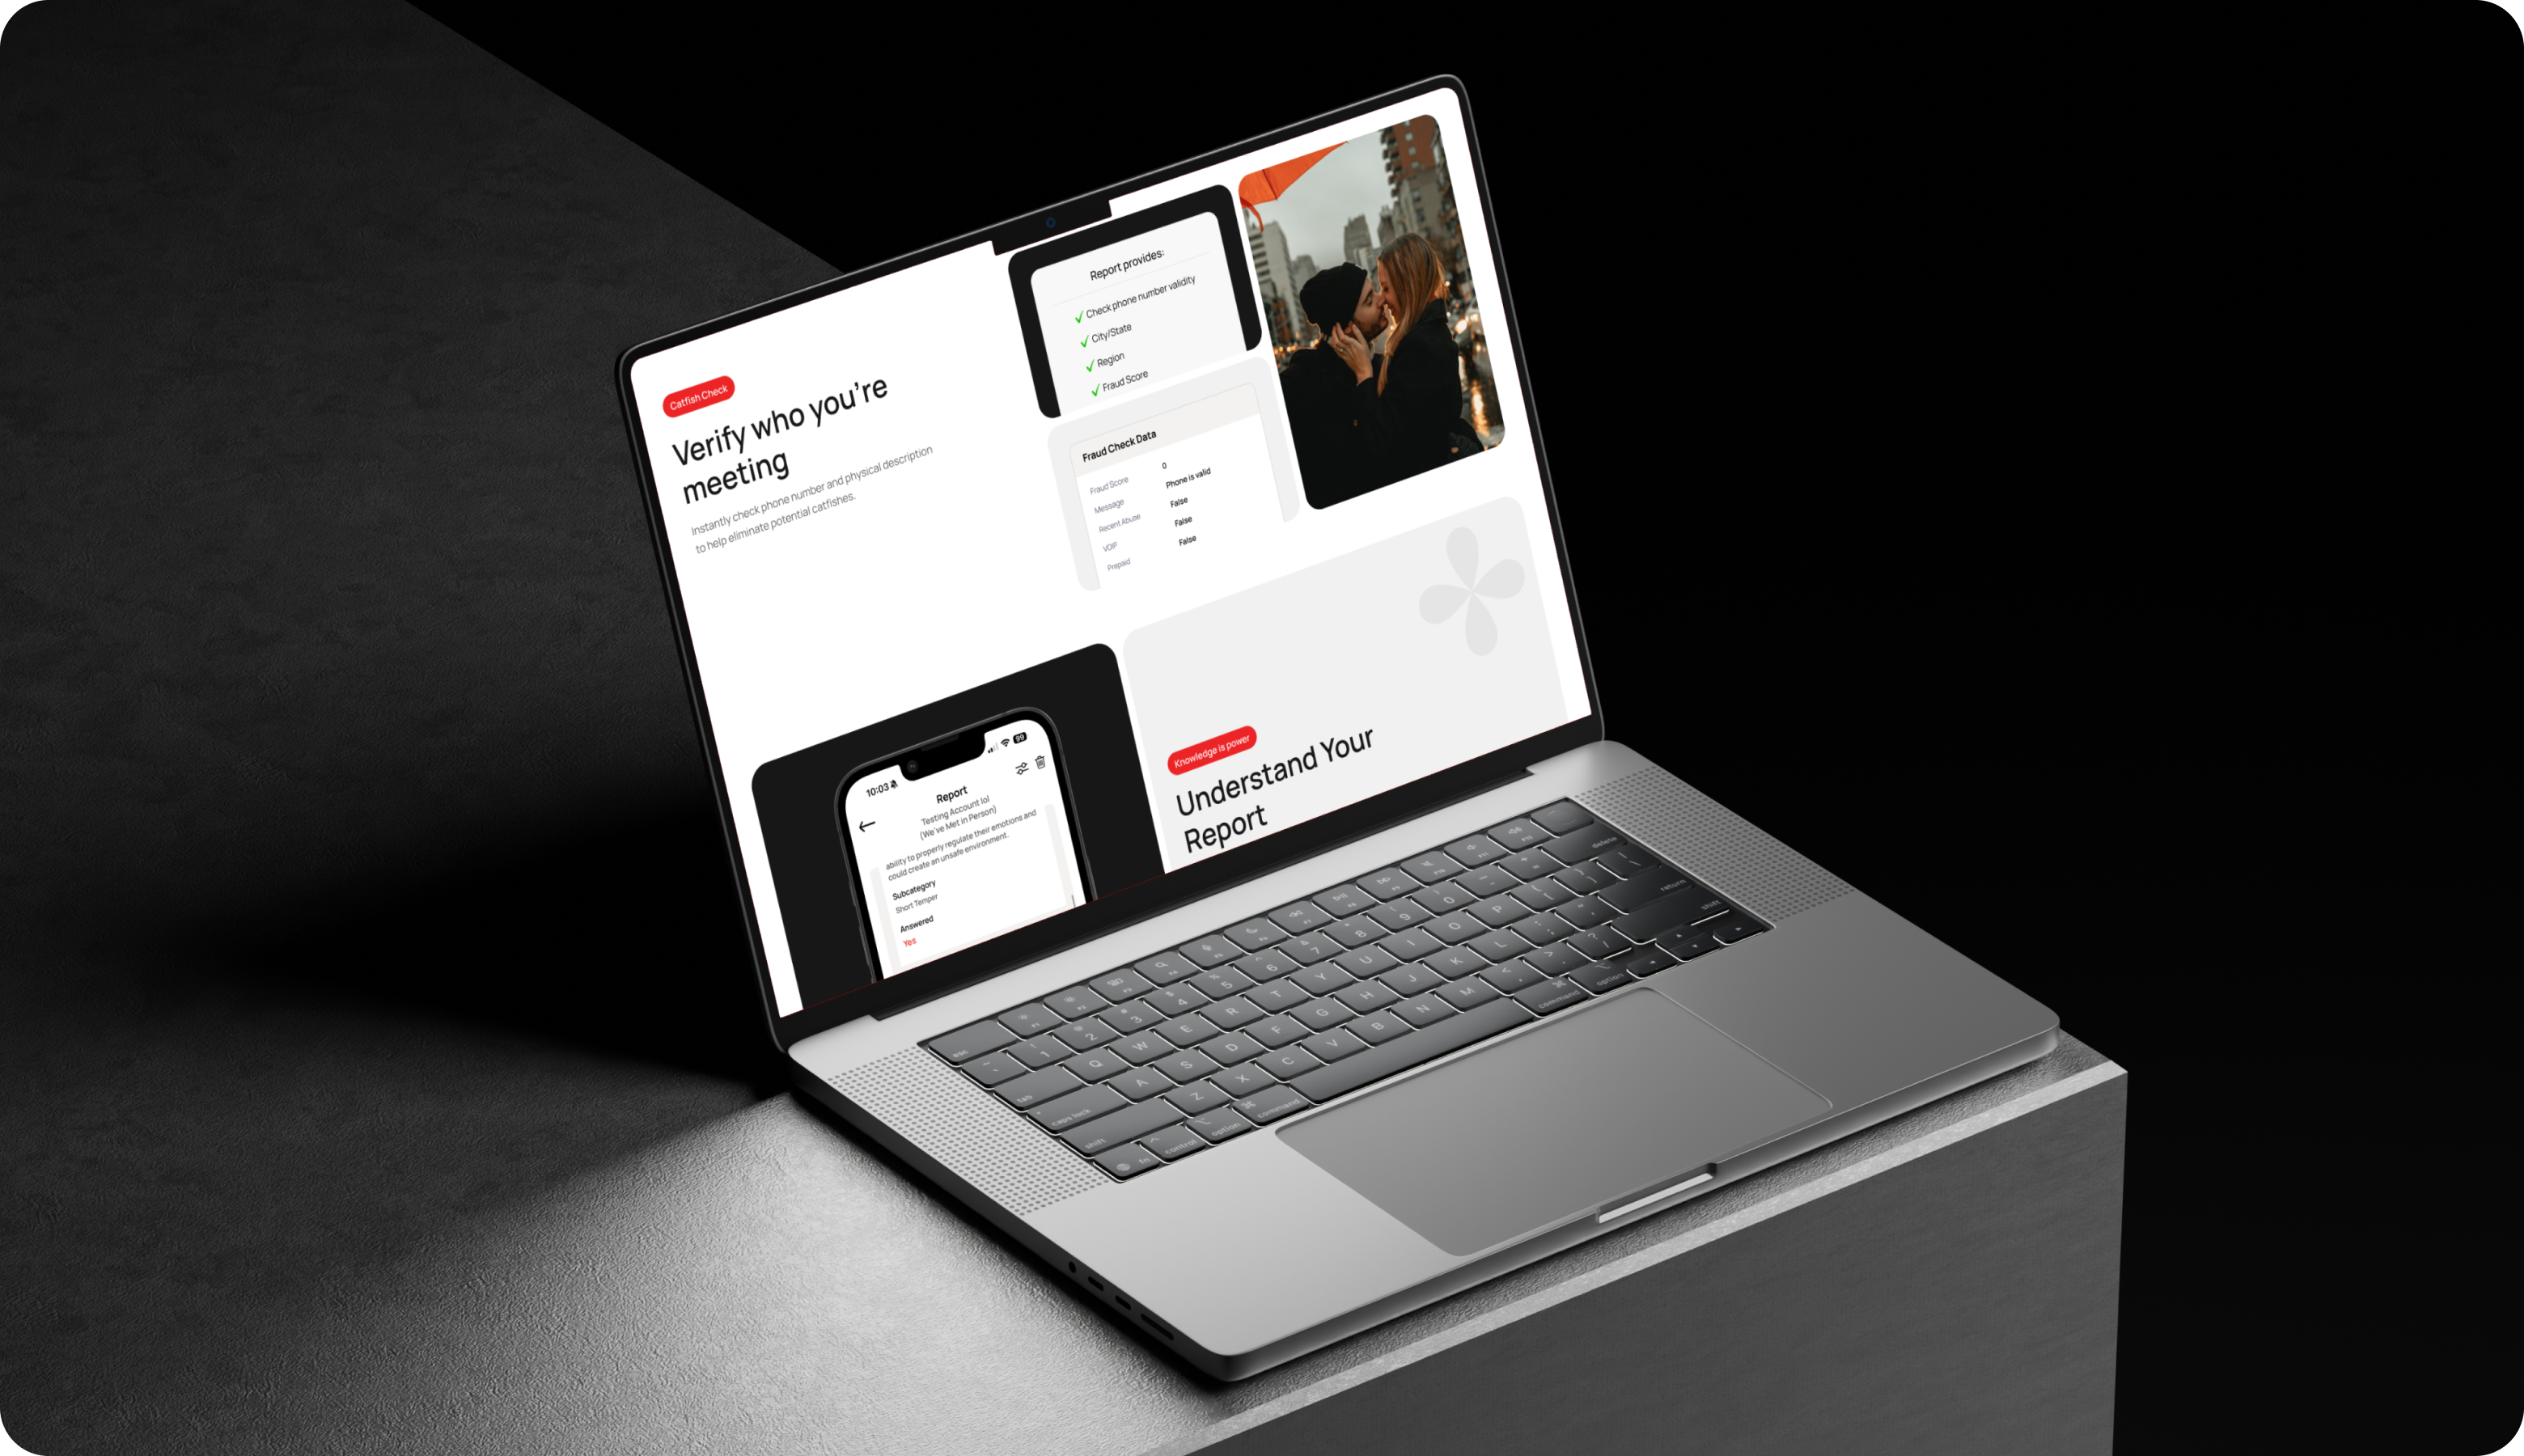
System Architecture
A financial data ingestion layer connects to ERP, banking, and payment systems — normalizing transaction streams and feeding structured analytics pipelines.
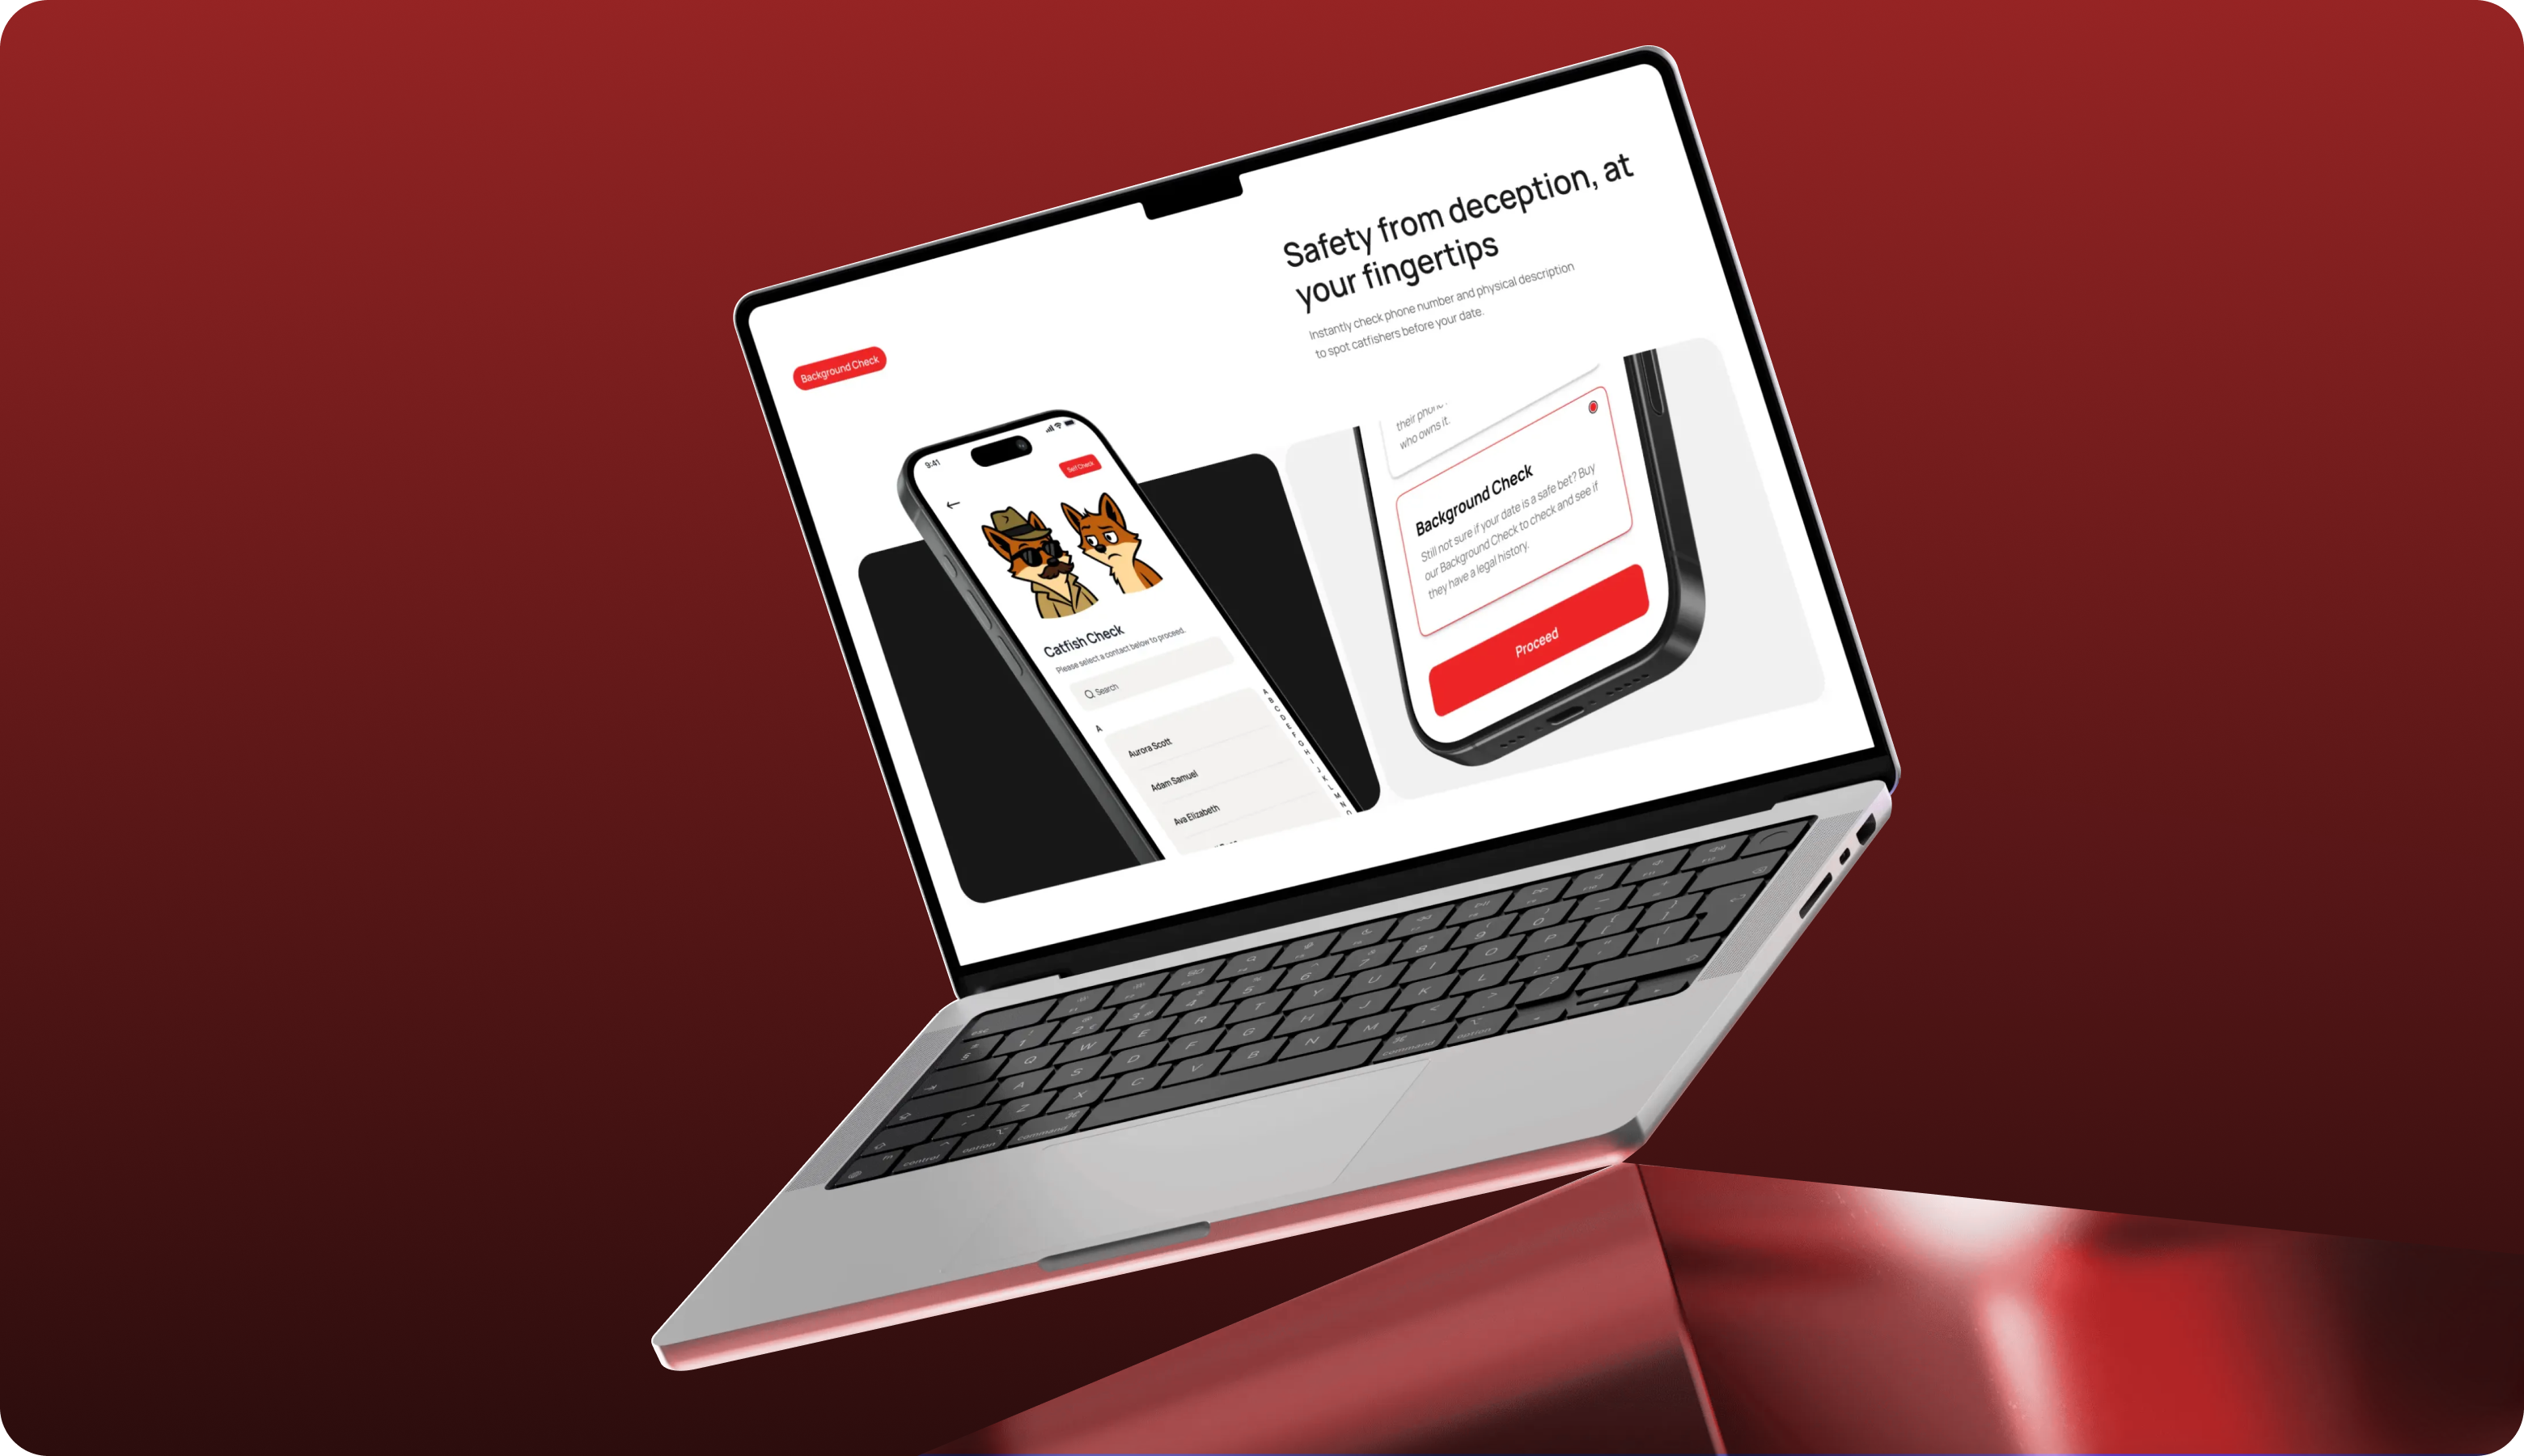
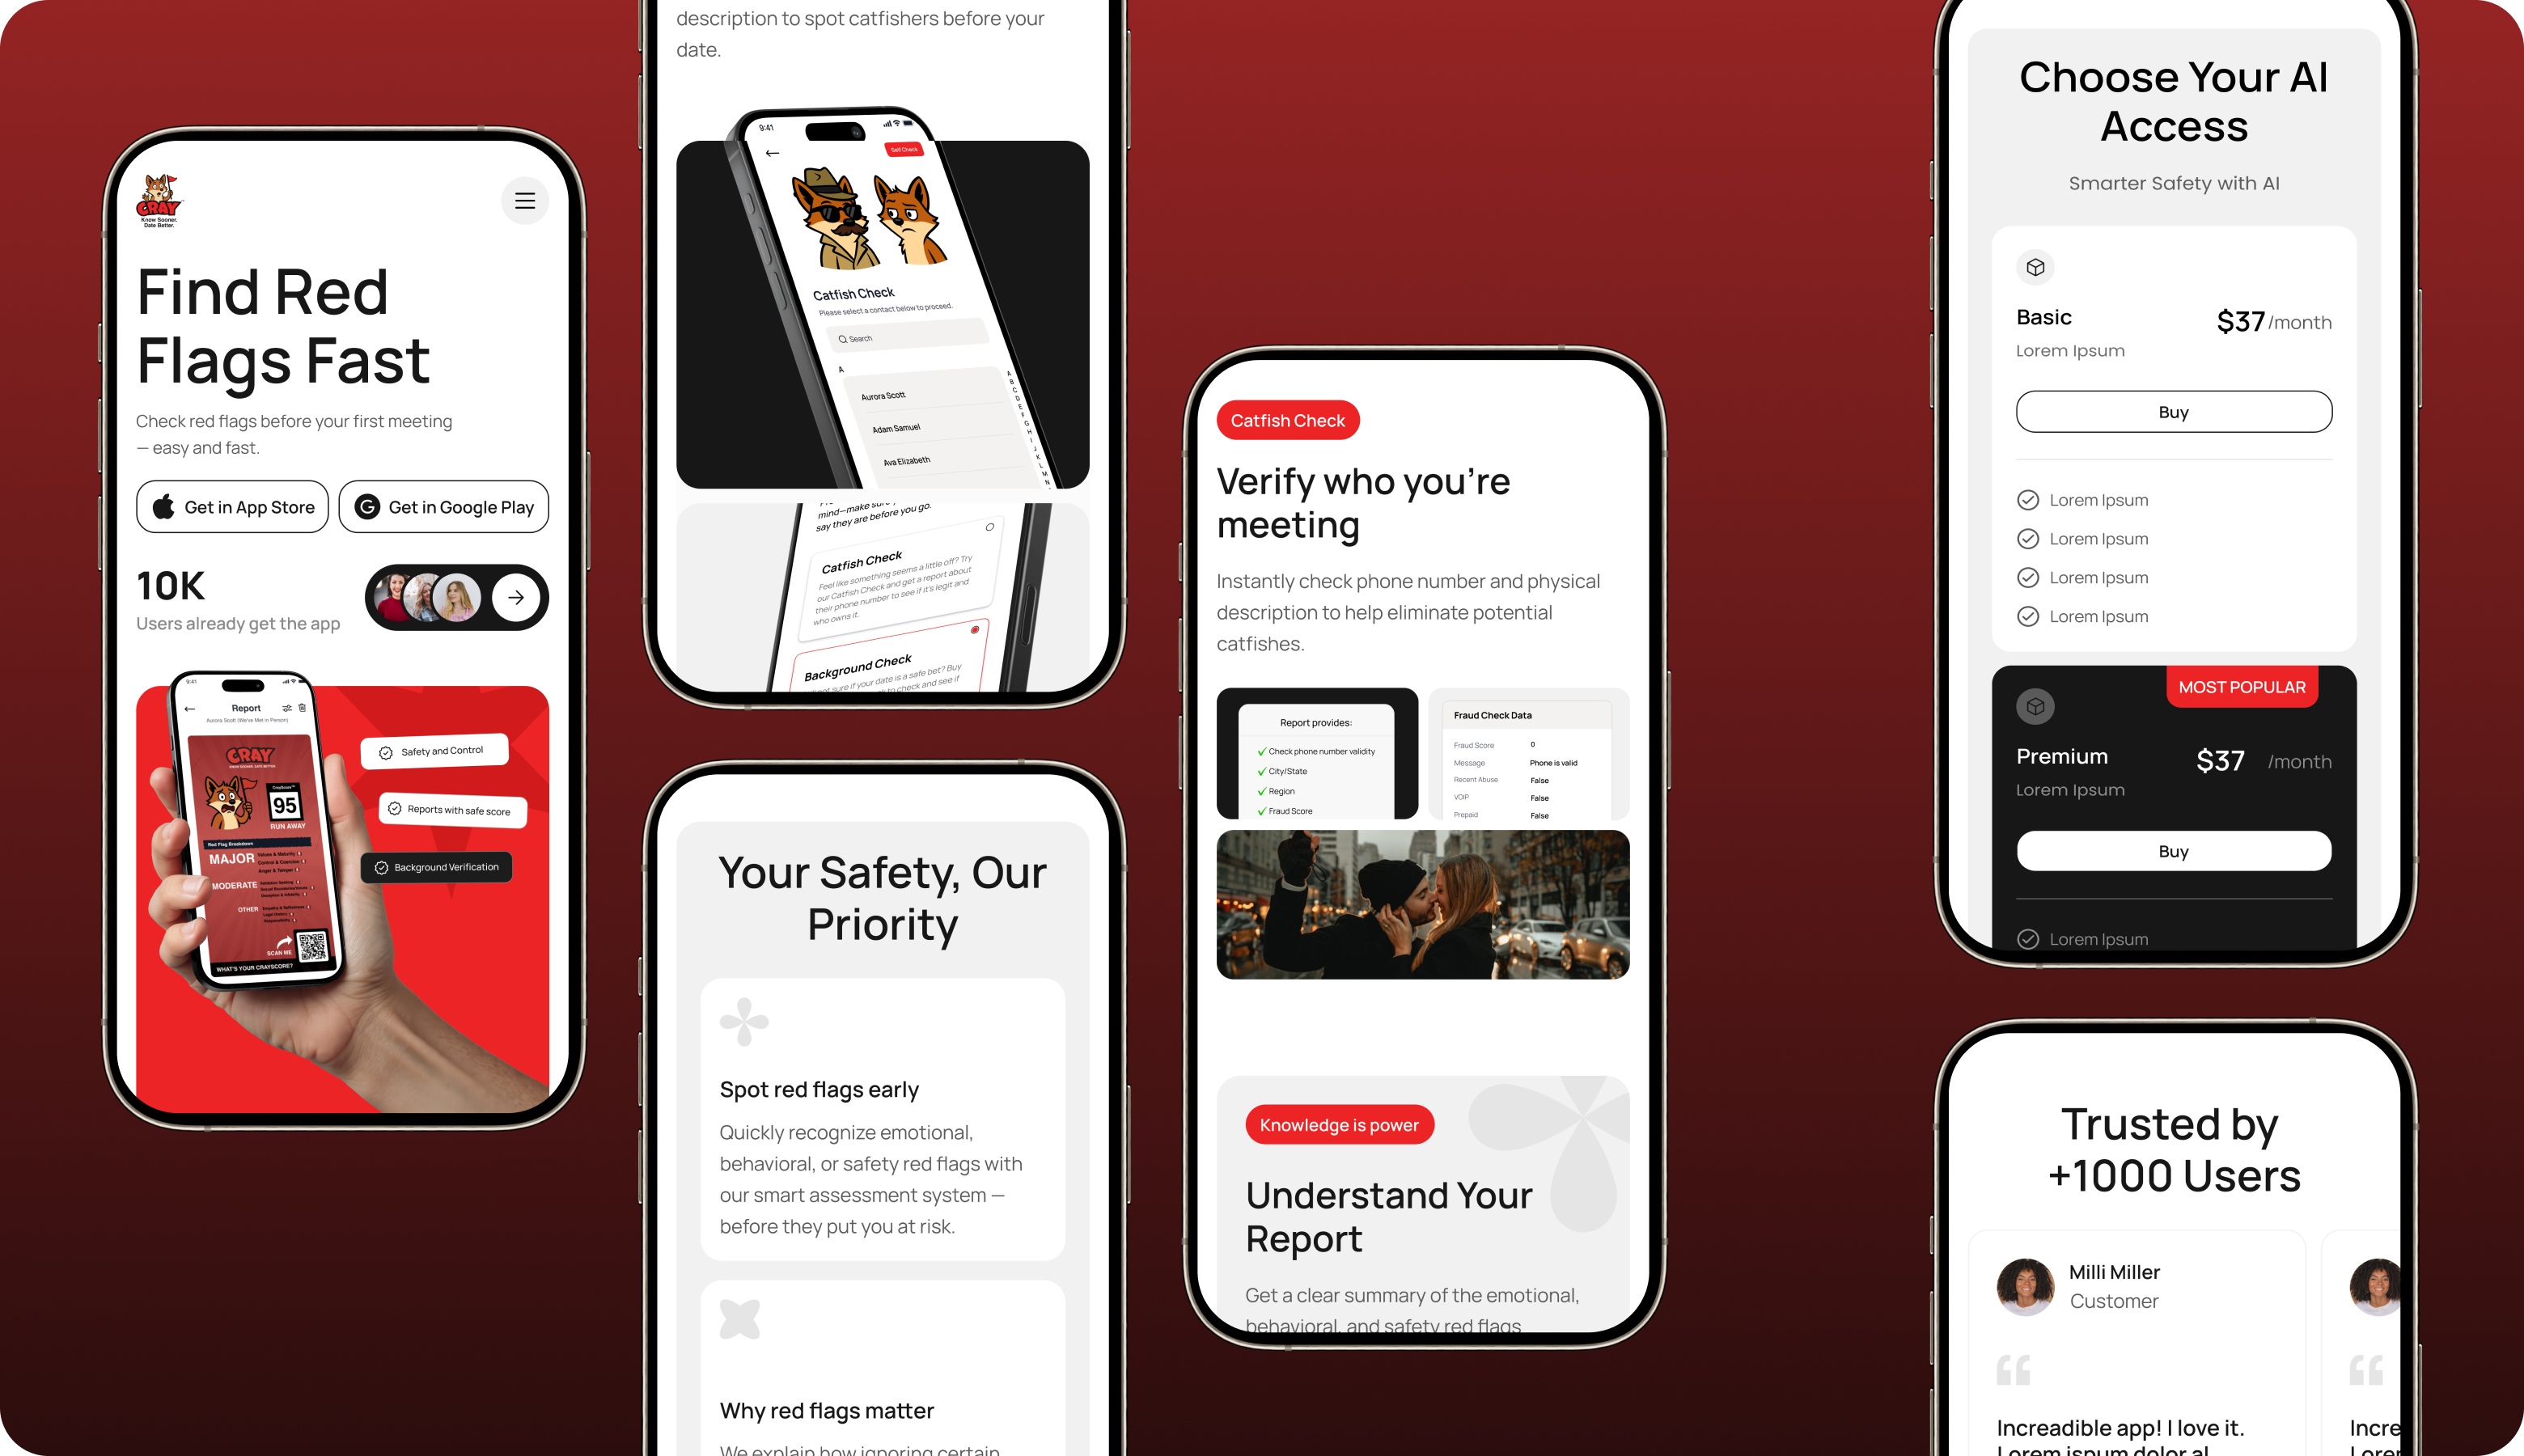
Interface Engineering
CFO dashboards surface P&L trends, budget variance charts, and forecast confidence intervals in a clean, executive-oriented layout optimized for fast review.
Real-time financial clarity — from raw transactions to strategic decisions.
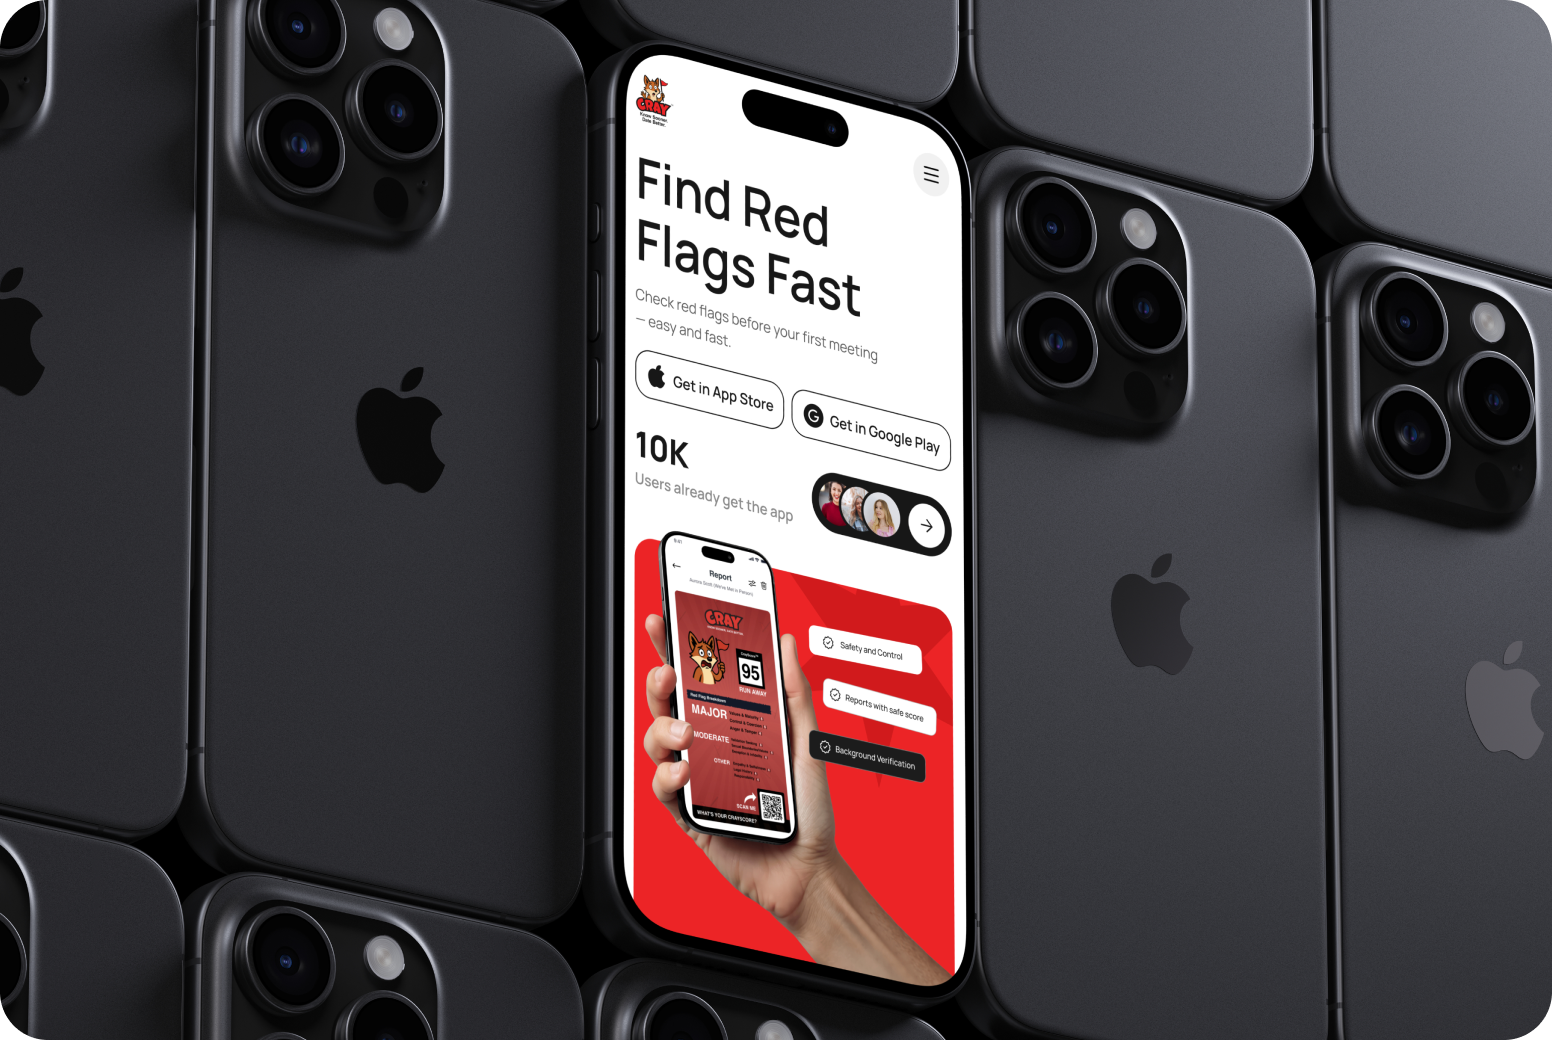
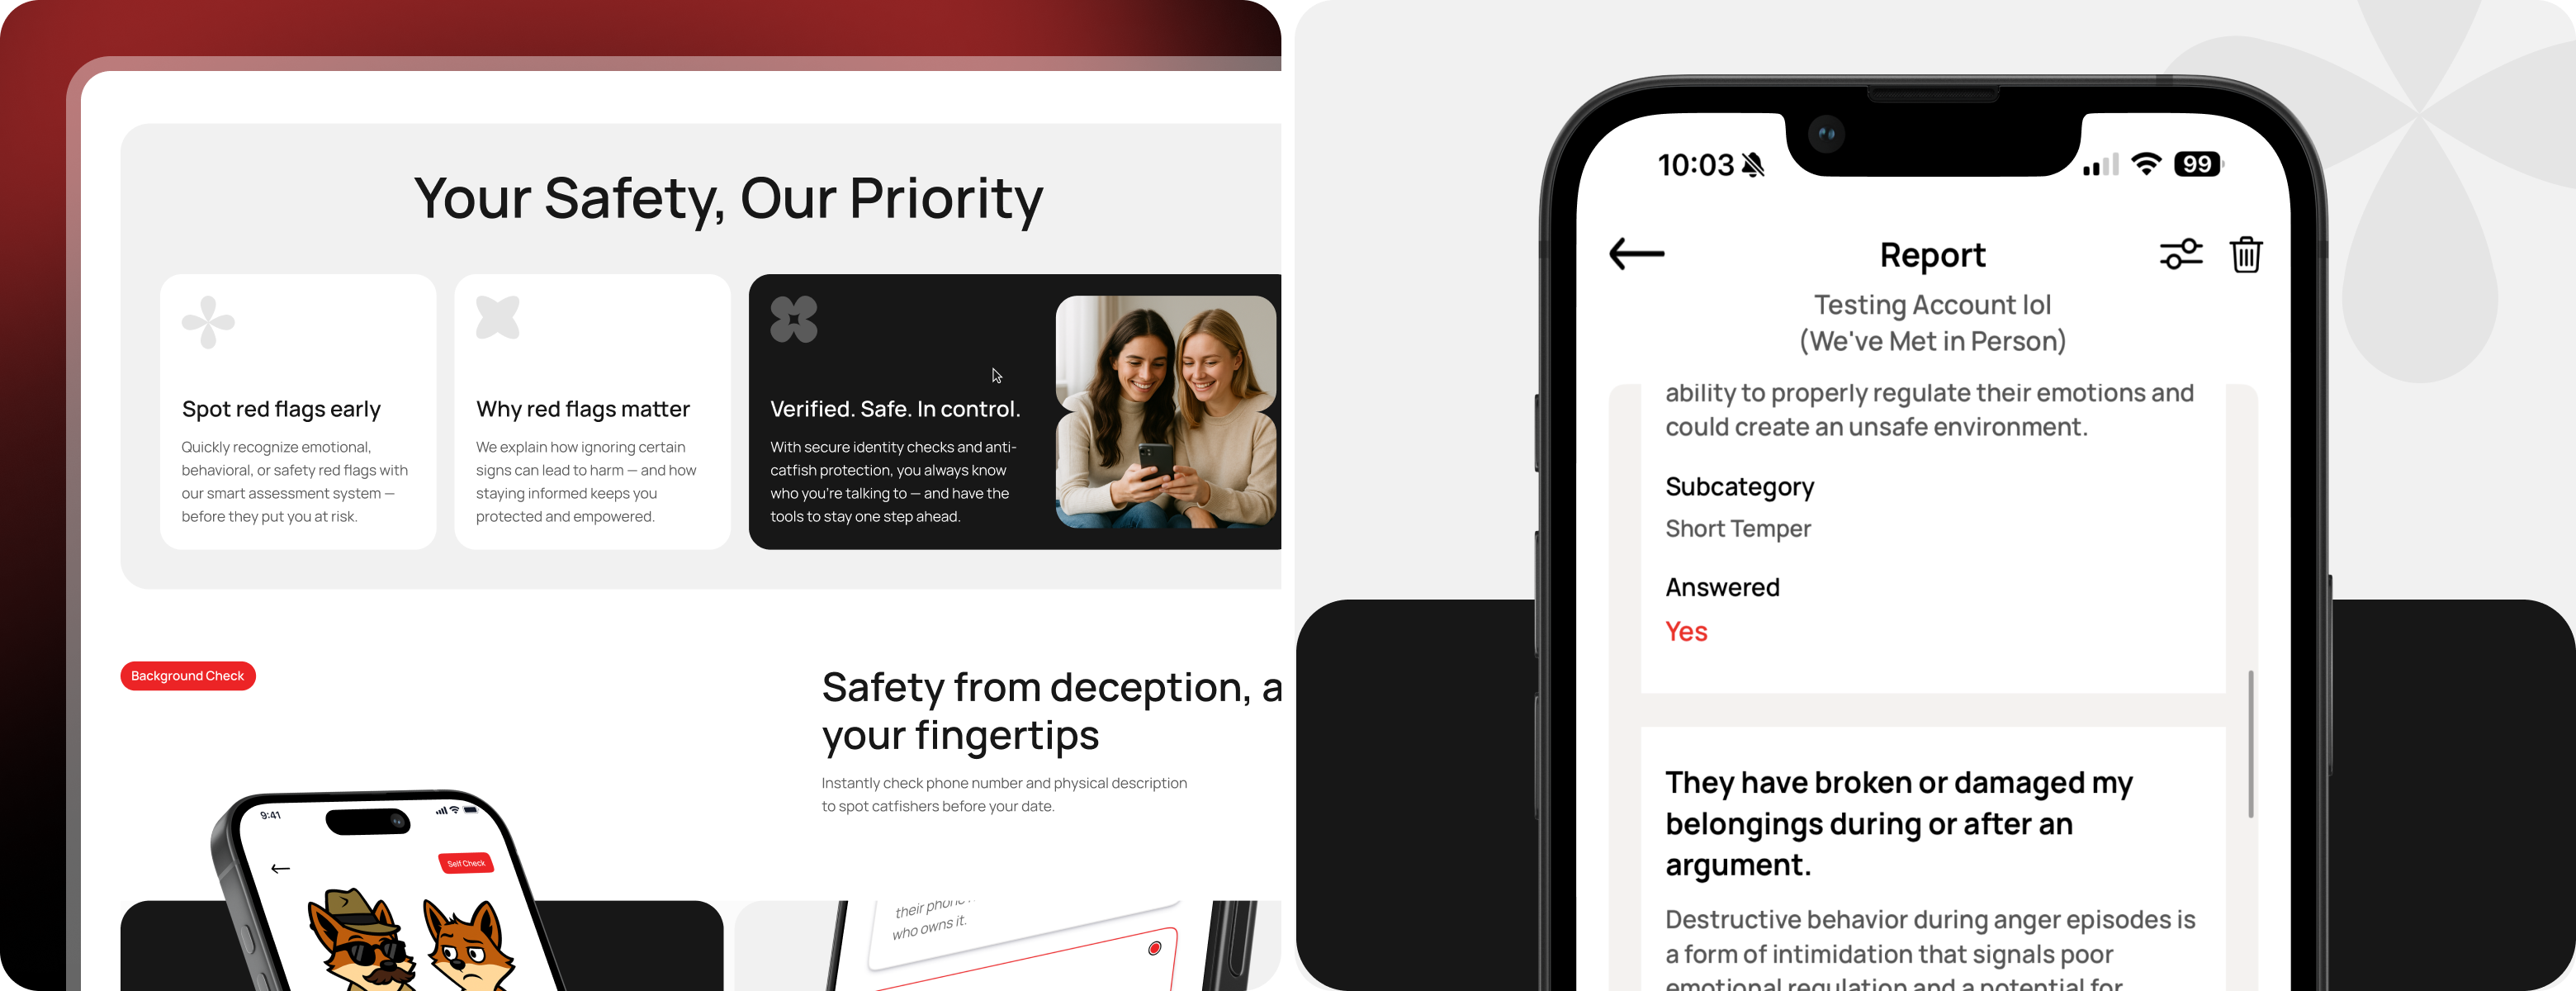
MOBILE-FIRST
EXECUTION
Mobile financial monitoring enables real-time budget alerts, expense approval workflows, and key metric snapshots for finance leaders between meetings.

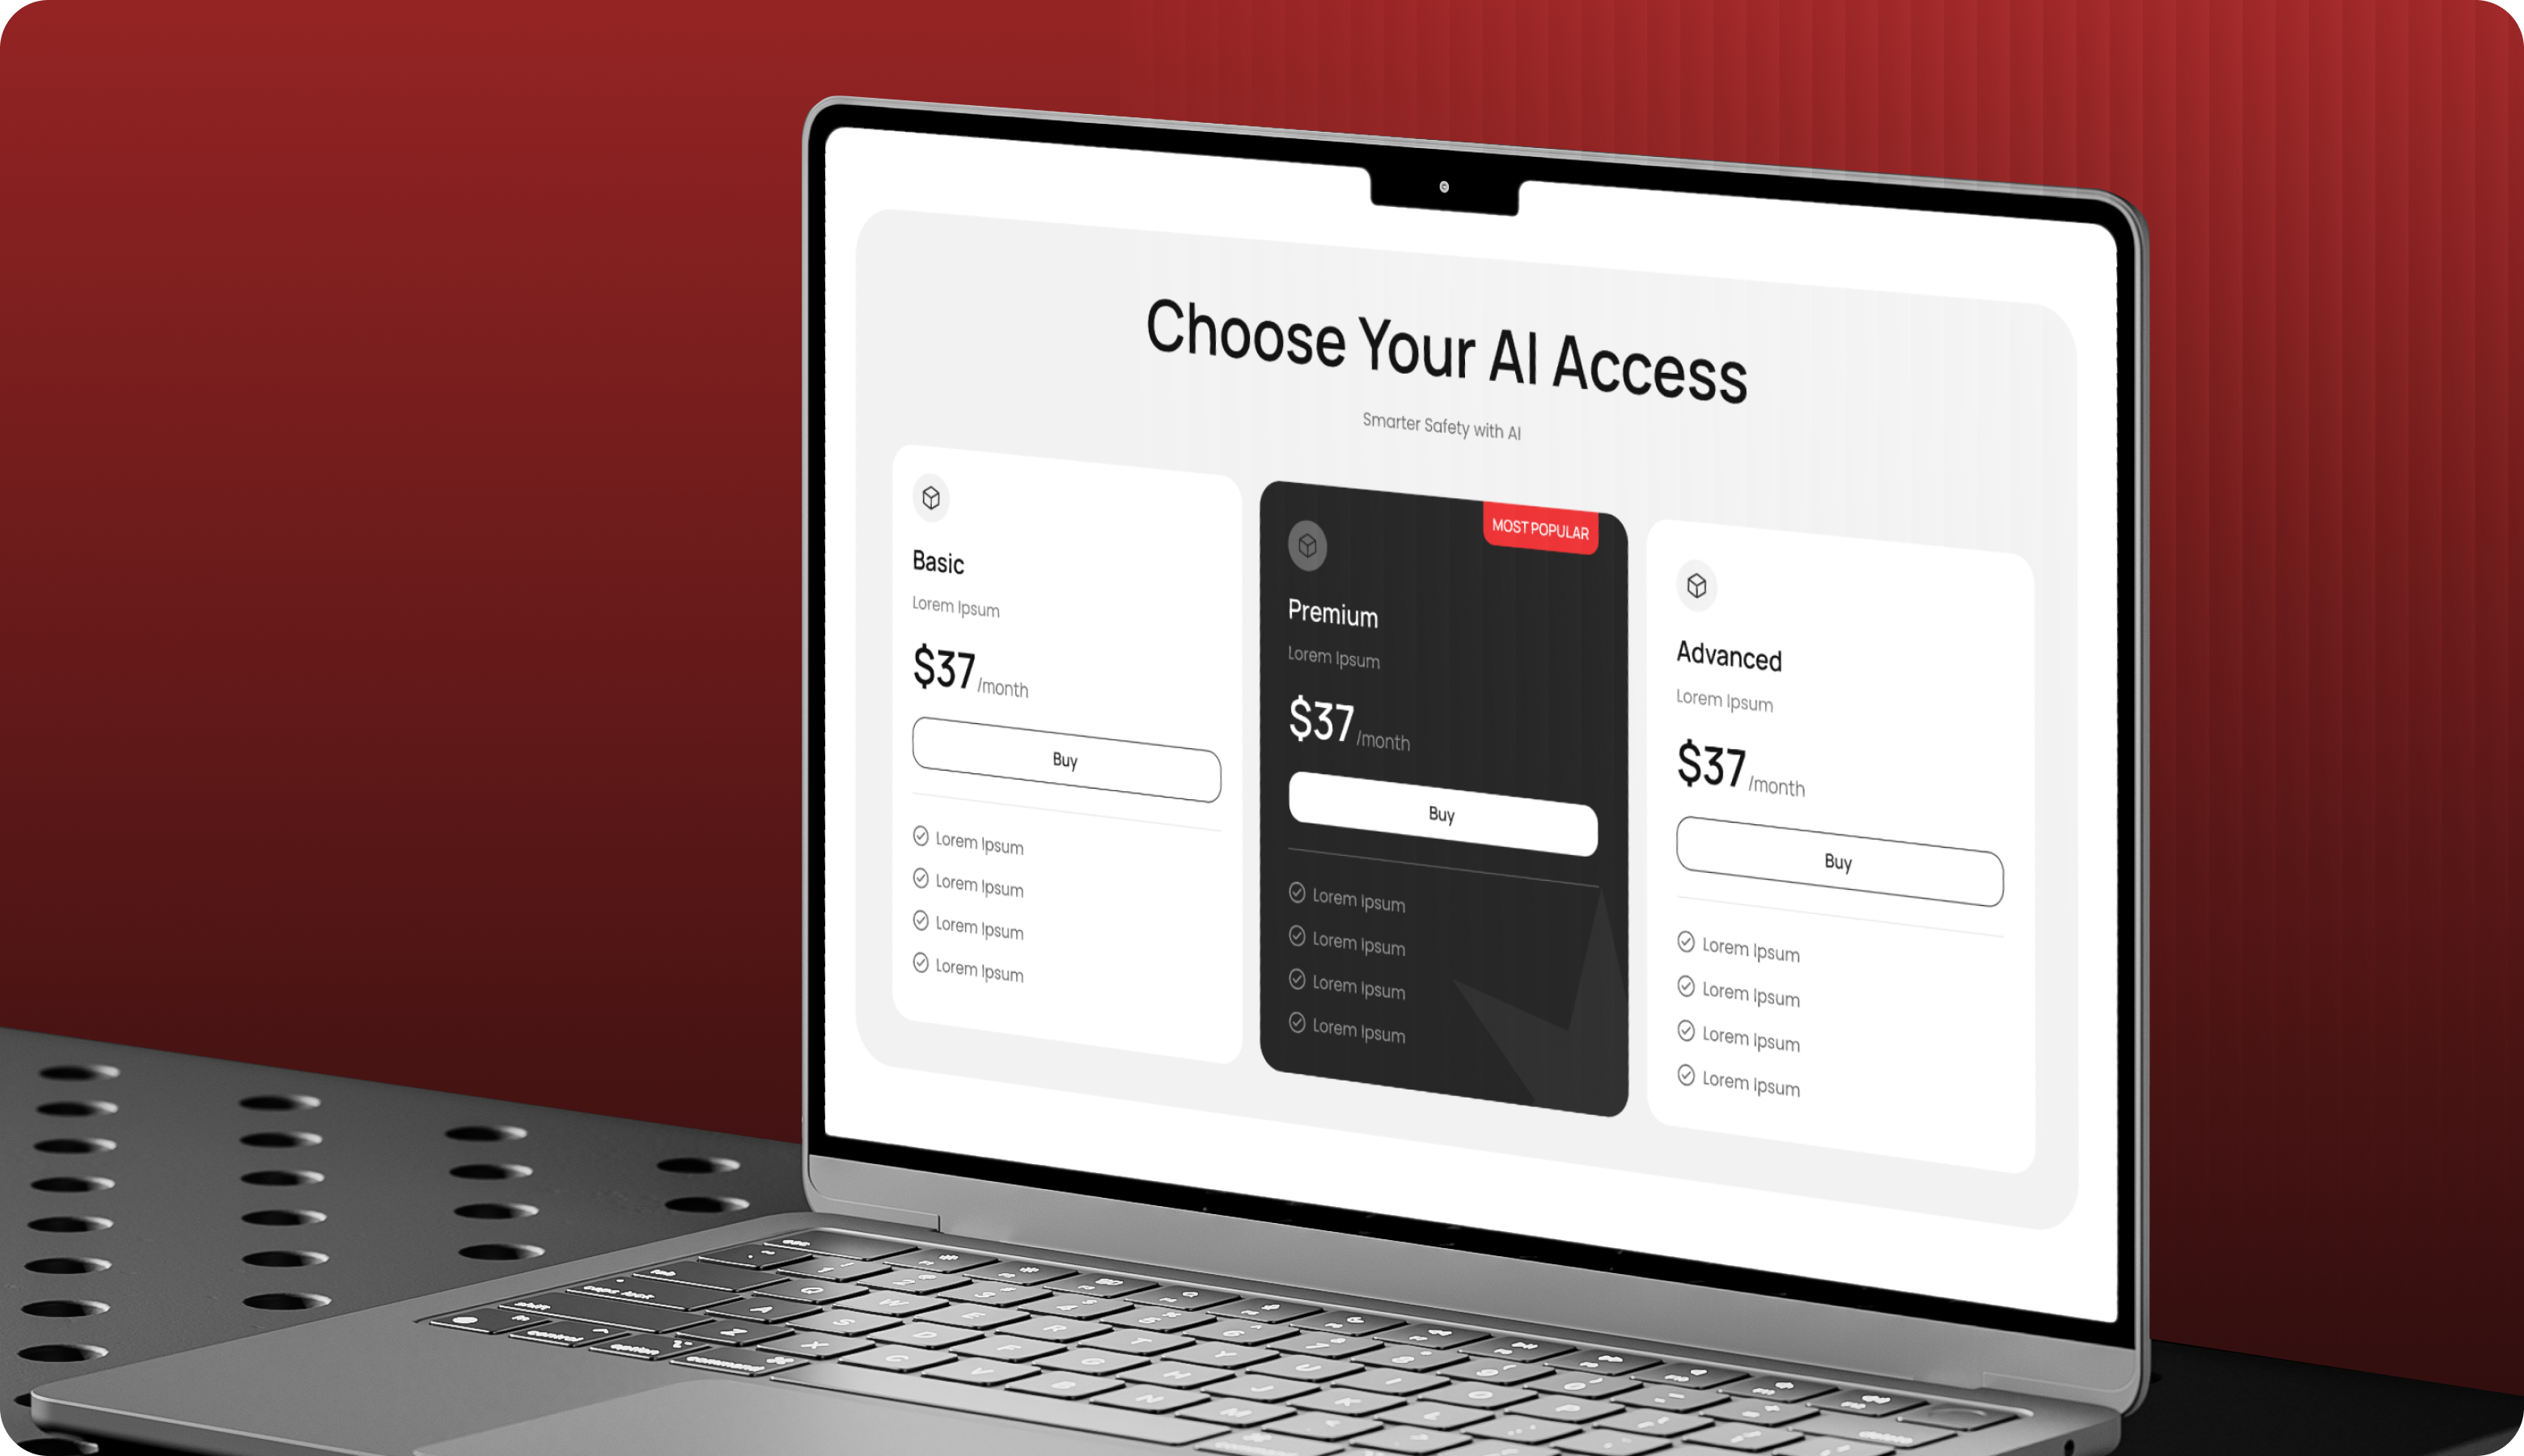
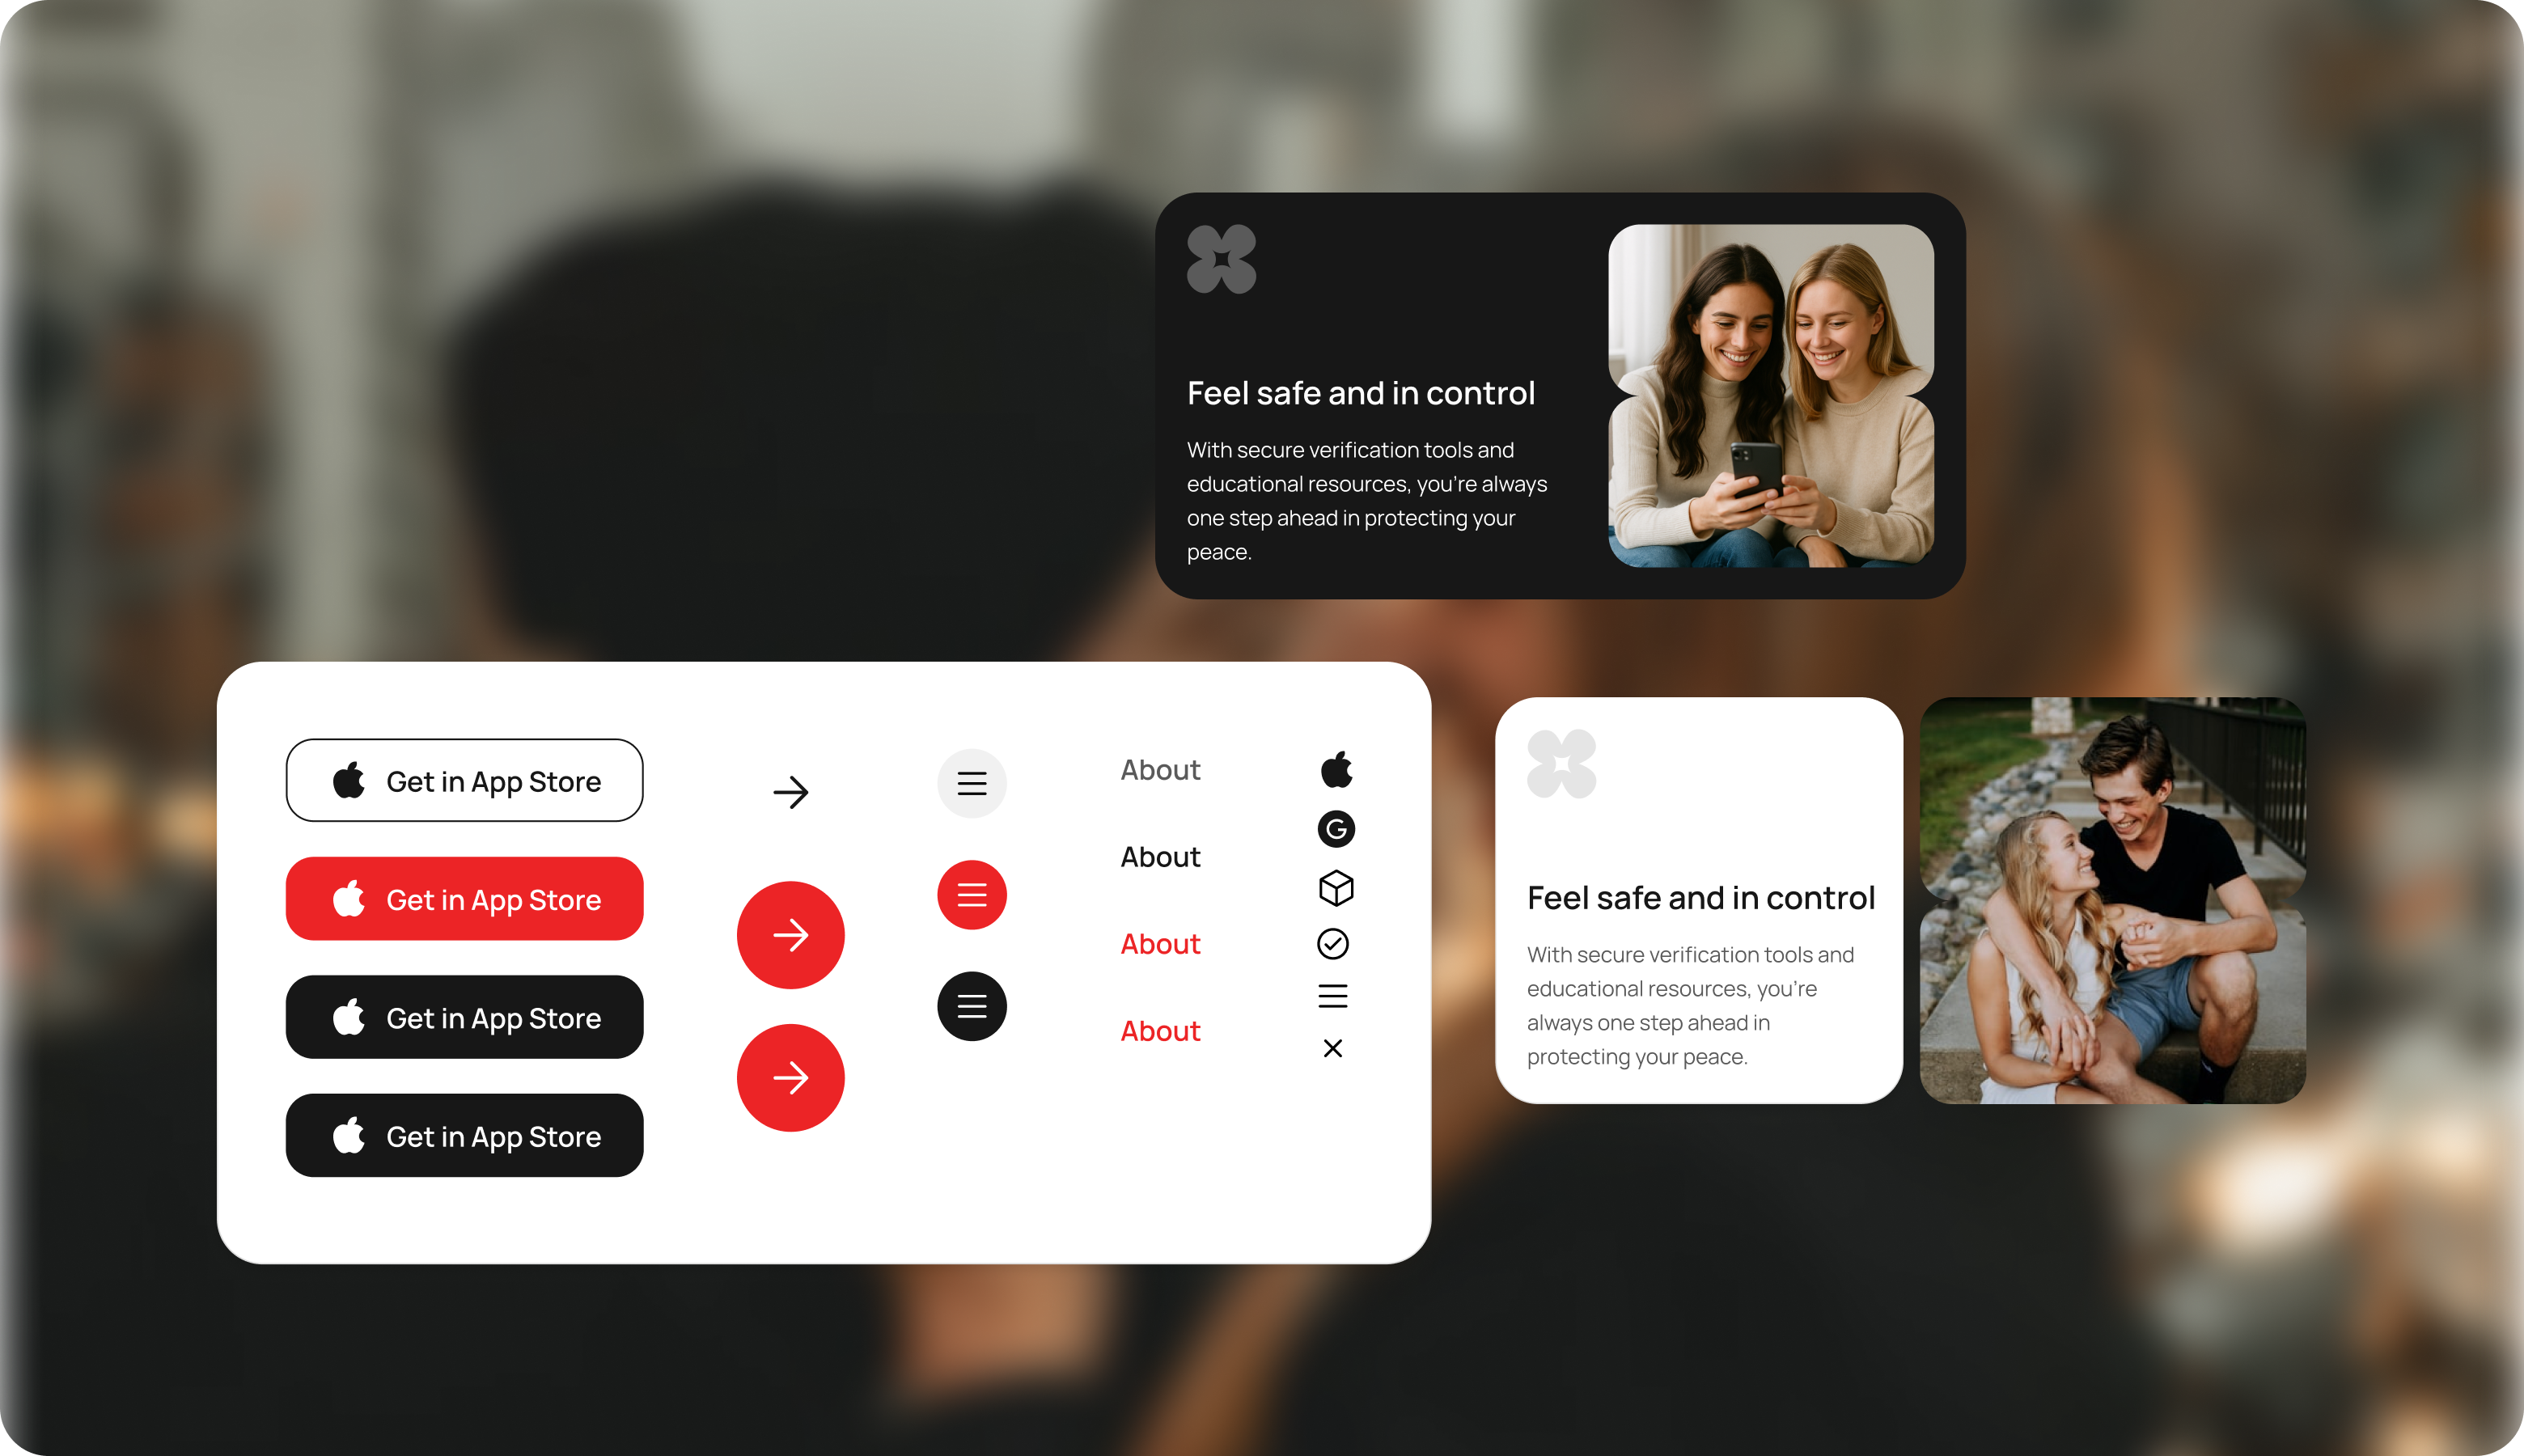
UI Kit
Component library includes KPI cards, sparkline charts, budget comparison bars, variance highlight tables, and forecast confidence bands.
AUTOMATION
FRAMEWORK
Transaction categorization, budget variance alerts, monthly close reporting, and forecast model updates are fully automated through the analytics engine.

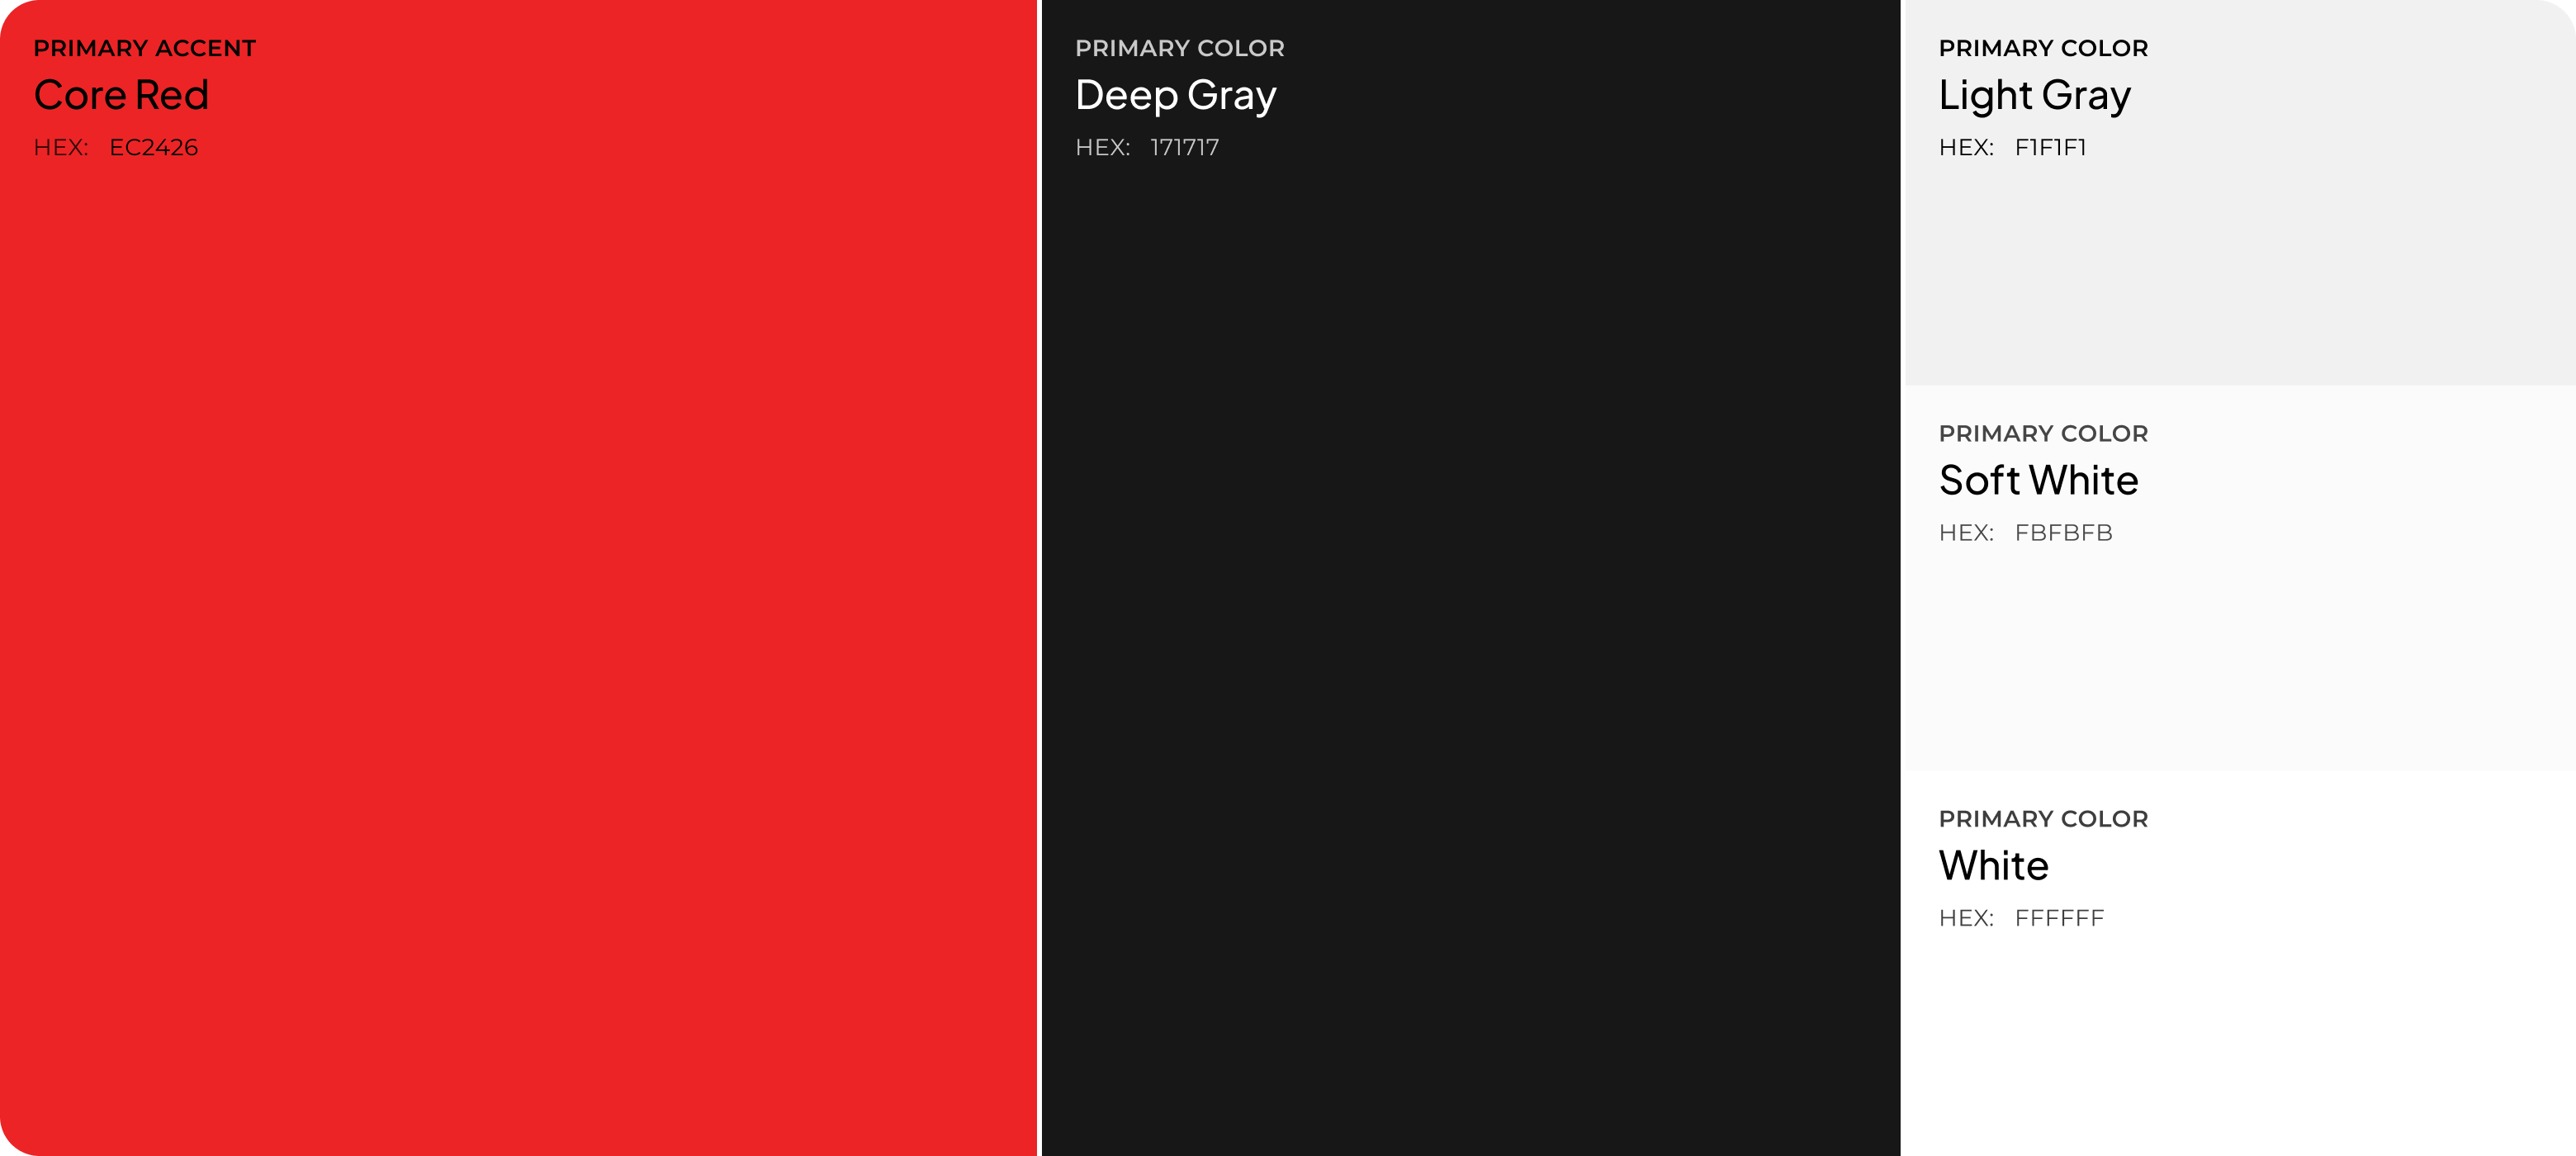
Design system


Results
Measurable outcomes from real-world AI and engineering deployments.
-74%
Reduction in financial reporting cycle time
+63%
Improvement in budget forecast accuracy
6×
Faster variance detection and response
-48%
Reduction in manual reconciliation overhead
Verified across 500+ enterprise deployments
Let's work together
3-day AI Engineering Collaboration
Sprint
AI-driven collaboration sprint with senior engineers to design, build, and refine real-world software solutions. Focused on execution, technical depth, AI capability, and product thinking—not just ideas, but working systems.